View Source Throughput - Multiple Teams - Multi-plot
Fitting data to known distributions use is done using Chi2Fit.
This note contains an example analysis for 6 teams.
This note demonstrates how to use the multi-plot feature of GNUplot.
set-up
Set-up
import Chi2fit.GnuplotlibChi2fit.Gnuplotlib
multi-plots
Multi-plots
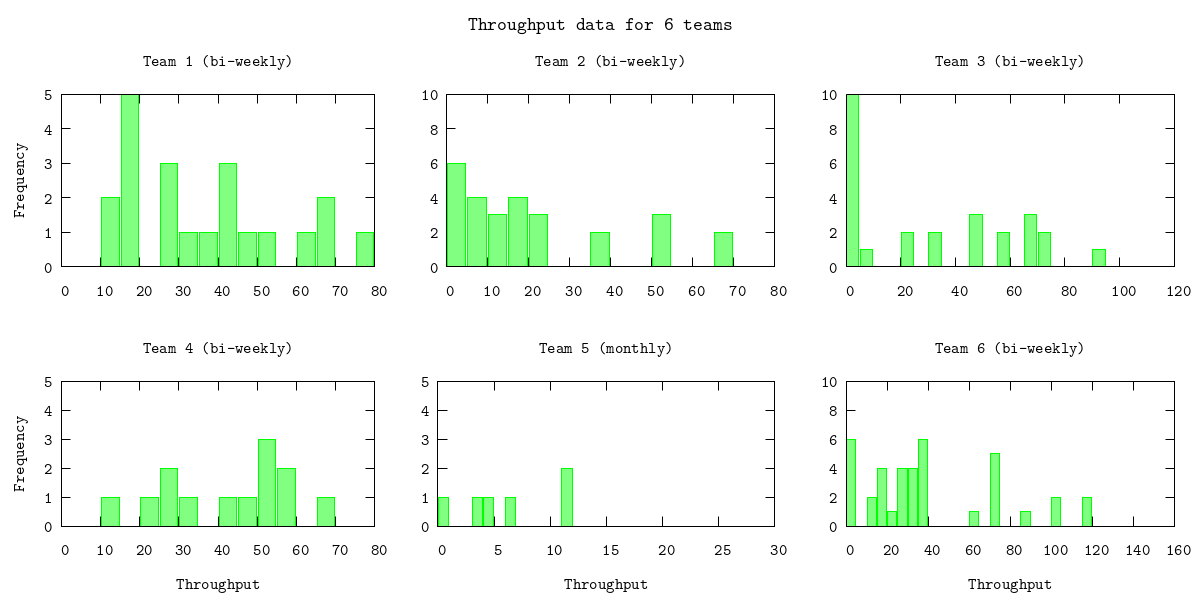
The following shows the sequences for the throughput (number of work items completed per period) for six teams. The most recent period is the first item in the list. Note that fort all teams the global bin size (see above) applies except for teams 5 for which we will use a bin size of 5.
all_data = %{
    "Team 1" => [69,41,53,41,41,48,69,15,15,12,12,15,31,78,62,16,25,28,25,38,16],
    "Team 2" => [50,68,36,50,50,68,36,19,15,23,9,15,3,23,23,9,14,2,9,9,14,19,11,0,1,1,1],
    "Team 3" => [55,46,46,70,55,70,91,67,49,7,20,34,68,68,20,31,0,0,0,0,0,4,0,0,0,3],
    "Team 4" => [55,47,65,50,50,50,57,44,27,25,14,23,30],
    "Team 5" => [
        throughput: [11,4,11,3,6,0],
        bin: 1
    ],
    "Team 6" => [70,70,86,116,70,103,103,116,73,28,28,35,26,35,70,32,32,26,60,37,19,37,19,16,10,13,31,37,31,24,16,37,3,2,2,4,2,2],
}
:"do not show this result in output"
We will start by showing a histogram of the raw throughput data:
multi([
    histogram(all_data["Team 1"], bin: 5, plottitle: "Team 1 (bi-weekly)", ylabel: "Frequency", xrange: '[0:80]', yrange: '[:5]', mode: :as_commands),
    histogram(all_data["Team 2"], bin: 5, plottitle: "Team 2 (bi-weekly)", xrange: '[0:80]', yrange: '[:10]', mode: :as_commands),
    histogram(all_data["Team 3"], bin: 5, plottitle: "Team 3 (bi-weekly)", xrange: '[0:120]', yrange: '[:10]', mode: :as_commands),
    histogram(all_data["Team 4"], bin: 5, plottitle: "Team 4 (bi-weekly)", xlabel: "Throughput", ylabel: "Frequency", xrange: '[0:80]', yrange: '[:5]', mode: :as_commands),
    histogram(all_data["Team 5"][:throughput], bin: 1, xlabel: "Throughput", plottitle: "Team 5 (monthly)", xrange: '[0:30]', yrange: '[:5]', mode: :as_commands),
    histogram(all_data["Team 6"], bin: 5, xlabel: "Throughput", plottitle: "Team 6 (bi-weekly)", xrange: '[0:160]', yrange: '[:10]', mode: :as_commands),
], columns: 3, title: "Throughput data for 6 teams", size: "1200,600")
:"this is an inline image"