Overview View Source
This library attempts to encode opinions and documentation for instrumenting an application with traces. It is in essence a wrapper for OpenTelemetry, which is a cross-language and platform-agnostic specification for creating application traces and exporting them into tools that can later visualize the traces.
Application Tracing
What the heck is application tracing?
Fundamentally, it is instrumenting code, specifically such that the execution of blocks of code
can be later visualized. These spans of code execution may be nested within a parent span,
each span including timing data and attributes. The combination of all of the spans for a
specific block of time represent a trace.
In terms of OpenTelemetry, every trace should include a single root span, within which there
may be N trees of child spans. Parent spans may or may not be closed before their children—in a
distributed system with async processing, a trace may span multiple systems, with requests
completing even though other process complete actions initiated by the request.
Let us take, as an example, an HTTP request to a Phoenix controller.
The HTTP request consists of a request and a response. At some point in the request, a span may
be opened. Since this is the first span, representing the root, a trace-id is generated. Inside
the controller action, one or more database queries may be made (each wrapped in its own span,
but inheriting the trace-id), after which the renderer executes and a response is sent to the
client. After the response is sent, callback functions may be executed before the cowboy
process exits. Some time either before or after the callbacks, the root span is ended.
This might be represented by the following time-based visualization:
 | GET / ------------------------------------------------------------------- |
   | db query 1 |
                 | db query 2 |
                                  | db query 3 |
                                                    | render -- |
                                                                 | response |
                                                                        | callback 1 |
                                                                          | callback 2 |
Distributed Tracing (ie Propagation)
A trace may involve multiple applications, or multiple runtimes. For instance, an HTTP request may generate asynchronous jobs in a tool such as Oban. A web application may involve browser-based Javascript as well as an Elixir backend.
For this reason a trace-id may be propagated between different systems. There are different
ways this could be implemented, but OpenTelemetry attempts to provide mechanisms that can be
configured per-application (so that every span touch point does not need to manually execute
the correct propagators).
Two popular mechanisms of propagating traces between systems are the
(W3C Trace-Context)[https://www.w3.org/TR/trace-context/] and
(B3 Propagation)[https://github.com/openzipkin/b3-propagation]. The former defines a single
format for encoding trace-id, span-id, and trace-specific flags in a traceparent header.
The latter is implemented by many open source trace aggregators.
Geometrics does two things to propagate traces from Phoenix to Javascript. First, there is a
plug that sets things from the current trace onto the conn, in private attributes as well as
response headers. Using the provided Phoenix view helpers in the root layout also writes out
configuration via meta tags that the javascript can hook into. Propagating the trace back to
other contexts (XHTML requests, websockets, live view, etc) may require some manual integration.
Theoretically, propagation mechanisms can be introduced that do everything automatically—in
practice this may not be possible (for instance, with Phoenix Channel/LiveView javascript which
does not not provide automatic hooks to alter connection headers).
Tracing vs Metrics
Many of us are familiar with the concept of metrics. How metrics overlaps with tracing may not be clear, however.
A metric tends to be an individual data point encapsulating some event at some point in time. When large amounts of metrics are produced, many systems begin aggregating the metrics. At any point in time, a tool for visualizing application metrics may only retain computed statistics and aggregations (sums, 95th percentile, etc).
Tracing takes a different approach, which is to capture correlated runtime data across spans of time, and send raw data to backend systems. If large amounts of traces are produced, they may be sampled at some rate to filter the traces that are actually sent.
Metrics tend to aggregate before exporting. Tracing sends as much data as possible, and relies on exporting to more sophisticated back-ends that can aggregate and analyze the aggregate traces on the fly.
Exporting traces
One thing that is important about OpenTelemetry is that it provides a specification for implementing application tracing across multiple languages, a normalized set of attributes for different types of traces (HTTP requests vs database queries, for example), and a vendor-agnostic protocol for exporting span traces to various 3rd-party tracing services (Honeycomb, Jaeger, Zipkin).
This means that a team can instrument their applications in one way, and swap out the service(s) used to analyze traces
if needed. In other words, you can choose to instrument your frontend and backend respectively with opentelemetry-js
and opentelemetry-erlang, and have both those libraries report data to Honeycomb using a consistent standard. The way
this was achieved was by standardizing that all OpenTelemetry language implementations must be able to communicate with
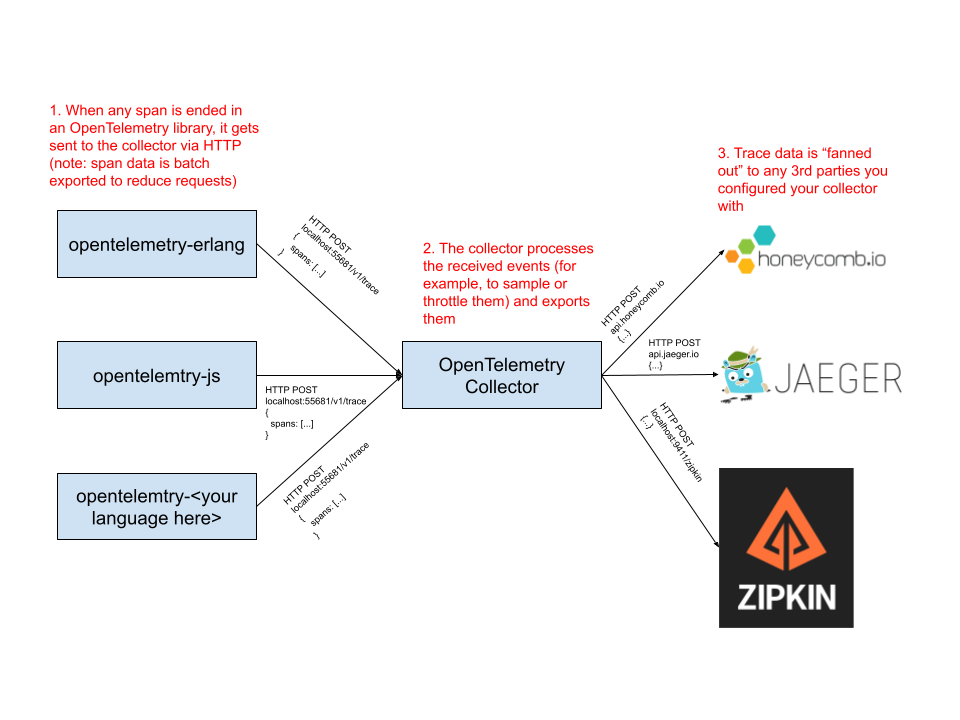
a running agent called an OpenTelemetry collector over HTTP.
The OpenTelemetry collector agent is used to collect traces using the vendor-agnostic protocol, then forward the traces to a 3rd party tracing service. This allows applications to export traces via a single mechanism, without having to care what happens later.
The diagram below illustrates how this looks.
OpenTelemetry gotchas
- Spans are only valid if they are ended, giving them a duration.
- Spans are only exported if they are valid.
- Timeout errors in Elixir/Erlang usually signal process exits, rather than raising exceptions.
:telemetryhelpers rescue/reraise exceptions, but do not catch exits.- Helper libraries like
OpentelemetryPhoenixandOpentelemetryEctohook into:telemetry, since they are unable to alter Phoenix/Ecto runtime code to introduceOpenTelemetry-specific helpers. - Ergo... an overloaded system that begins timing out in GenServer calls or database queries may lose the most important traces, ie those associated with the timeouts. See the Phoenix + Ecto page for more info.