
)
observer_cli
Authors: zhongwencool (zhongwencool@gmail.com).
Observer CLI is a library to be dropped into any beam nodes, to be used to assist DevOps people diagnose problems in production nodes, included panels are:
== Home ==

| Proc Count | process_count/process_limit | Smp Support | smp_support |
| Port Count | port_count/port_limit | Multi Scheduling | multi_scheduling |
| Atom Count | atom_count/atom_limit | Logical Processors | logical_processors |
-
process_limit:
erl +P Numbersets the maximum number of simultaneously existing processes for this system if a Number is passed as value. Valid range for Number is [1024-134217727]. The default value is 262144. - port_limit:
erl +Q Numbersets the maximum number of simultaneously existing ports for this system if a Number is passed as value. Valid range for Number is [1024-134217727]. The default value used is normally 65536. However, if the runtime system is able to determine maximum amount of file descriptors that it is allowed to open and this value is larger than 65536, the chosen value will increased to a value larger or equal to the maximum amount of file descriptors that can be opened. - atom_limit:
erl +t sizesets the maximum number of atoms the virtual machine can handle. Defaults to 1,048,576.
| ps -o pcpu | cpu utilization of the process in "##.#" format. Currently, it is the CPU time used divided by the time the process has been running (cputime/realtime ratio), expressed as a percentage. It will not add up to 100% unless you are lucky. . |
| ps -o pmem | ratio of the process's resident set size to the physical memory on the machine, expressed as a percentage. |
| Total | The total amount of memory currently allocated. |
| Process | The total amount of memory currently used by the Erlang processes. |
| Atom | The total amount of memory currently used for atoms. |
| ETS | The total amount of memory currently allocated for ETS tables. |
| Binary | The total amount of memory currently allocated for binaries. |
| Code | The total amount of memory currently allocated for Erlang code. |
| active task | returns the same as statistics(active_tasks_all) with the exception that no information about the dirty IO run queue and its associated schedulers is part of the result. That is, only tasks that are expected to be CPU bound are part of the result. |
| context switches | returns the total number of context switches since the system started. |
| reductions(total/sinceLastCall) | total reductions/reductions since last call. |
| io | The total number of bytes received/send through ports and the receive/send bytes through ports of growth during the refresh interval. |
| garbage_collection | erlang:statistcs(garbage_collection) which is return total value and the {Number_of_GCs, Words_Reclaimed} of growth during the refresh interval. |
| run_queue | The total length of all normal run-queues. That is, the number of processes and ports that are ready to run on all available normal run-queues. Dirty run queues are not part of the result. |
Increments are values that are mostly useful when compared to a previous one to have an idea what they're doing, because otherwise they'd never stop increasing: bytes in and out of the node, number of garbage colelctor runs, words of memory that were garbage collected, and the global reductions count for the node.
Scheduler utilization by erlang:statistics(scheduler_wall_time):- Total scheduler utilization will equal 1.0 when all schedulers have been active all the time between the two refresh interval.
- The result being that there is a decent chunk of CPU usage that would be mostly free for scheduling actual Erlang work (assuming the schedulers are busy waiting more than trying to select tasks to run), but is being reported as busy by the OS.
- the scheduler usage may show a higher rate (1.0) than what the OS will report. Schedulers waiting for os resources are considered utilized as they cannot handle more work. If the OS itself is holding up on non-CPU tasks it is still possible for Erlangâs schedulers not to be able to do more work and report a full ratio.
== Process ==
When looking for high memory usage, for example it's interesting to be able to list all
of a node's processes and find the top N consumers. Enter m then press Enter will use the
recon:proc_count(memory, N) function, we can get:
 recon:proc_count/2
and recon:proc_window/3
are to be used when you require information about processes in a larger sense:
biggest consumers of given process
recon:proc_count/2
and recon:proc_window/3
are to be used when you require information about processes in a larger sense:
biggest consumers of given process memory, reductions, binary, total_heap_size, message_queue_len,
either absolutely or over a sliding time window, respectively.
More detail about sliding time windows see recon:proc_window/3
When an abnormal process is found, enter the suspected process sequence(Integer) then pressEnter will use
erlang:process_info/2 to show
a lot of information available(which is safe to use in production) about processes.

-
registered_name: if the process has a name (as registered with
erlang:register/2), it is given here. -
trap_exit: set
trap_exitto true, exit signals arriving to a process are converted to{EXIT,From,Reason}messages, which can be received as ordinary messages. Iftrap_exitis set to false, the process exits if it receives an exit signal other than normal and the exit signal is propagated to its linked processes. Application processes are normally not to trap exits. -
group_leader: the group leader of a process defines where IO (files, output of
io:format/1-3) goes. - initial_call: is the initial function call with which the process was spawned.
- links: is a list of process identifiers and port identifiers, with processes or ports to which the process has a link.
-
monitored_by: A list of process identifiers monitoring the process (with
monitor/2). -
monitors: A list of monitors (started by
monitor/2) that are active for the process. For a local process monitor or a remote process monitor by a process identifier. -
status: the nature of the process as seen by the scheduler. The possible values are:
-
exitingthe process is done, but not fully cleared yet; -
waitingthe process is waiting in areceive ... end; -
runningself-descriptive; -
runnableready to run, but not scheduled yet because another process is running; -
garbage_collectingself-descriptive; -
suspendedwhenever it is suspended by a BIF, or as a back-pressure mechanism because a socket or port buffer is full. The process only becomes runnable again once the port is no longer busy
-
- reductions: The VM does scheduling based on reductions, an arbitrary unit of work that allows rather portable implementations of scheduling (time-based scheduling is usually hard to make work efficiently on as many OSes as Erlang runs on). The higher the reductions, the more work, in terms of CPU and function calls, a process is doing.
-
memorys: Includes call stack, heap, and internal structures.
total_heap_size, min_bin_vheap_size, min_heap_size, fullsweep_after, heap_size. - messages: A list of the messages to the process, which have not yet been processed, it is truncated when the term is too big.
- dictionary: Dictionary is the process dictionary, it is truncated when the term is too big.
-
current stack: The current call stack back-trace (stacktrace) of the process.
The stack has the same format as returned by
erlang:get_stacktrace/0. The depth of the stacktrace is truncated according tobacktrace_depthsystem flag setting. - state: Using sys:get_state(Pid, 2500) Gets the state of the process.
== Network ==

- Byte input/output: The byte of growth input/output during the refresh interval.
-
Total input/output: erlang:statistics(io)
returns
Input, which is the total number of bytes received through ports, andOutput, which is the total number of bytes output to ports.
TCP, UDP, SCTP) and returns the biggest Num consumers by
recon:inet_count/2 and
recon:inet_windows/3 .
Attribute name refer to inet:getstat/1.
- recv_oct: Number of bytes received by the socket.
- recv_cnt: Number of packets received by the socket.
- send_cnt: Number of packets sent from the socket.
- send_oct: Number of bytes sent from the socket.
-
cnt:
recv_cnt+send_cnt. -
oct:
recv_oct+send_oct.
Enter will use
recon:port_info/2
to show a lot of information available about port.

- id: internal index of a port. Of no particular use except to differentiate ports.
- name: type of the port â with names such as "tcp_inet", "udp_inet", or "efile".
- os_pid: If the port is not an inet socket, but rather represents an external process or program, this value contains the os pid related to the said external program.
- connected: Each port has a controlling process in charge of it, and this processâ pid is the connected one.
- links: Ports can be linked with processes, much like other processes can be. The list of linked processes is contained here. Unless the process has been owned by or manually linked to a lot of processes, this should be safe to use.
- monitors: Ports that represent external programs can have these programs end up monitoring Erlang processes. These processes are listed here
-
IO:
inputthe number of bytes read from the port.outputthe number of bytes written to the port. - queue_size: Port programs have a specific queue, called the driver queue24. This return the size of this queue.
- memory: this is the memory allocated by the runtime system for the port. This number tends to be small-ish and excludes space allocated by the port itself.
- sockname/peername: inet:sockname/1 a list of all local address/port number pairs for a socket.
- statistics: show port statistics by inet:getstat/2.
- options: show port options by inet:getopts/2.
== System ==

- System Info: erlang:system_info/1 returns various information about the allocators of the current system (emulator).
-
Allocator Info: recon_alloc:average_block_sizes(current|max)
check all all allocators in
allocatorand returns the average block sizes being used for mbcs and sbcs. This value is interesting to use because it will tell us how large most blocks are. This can be related to the VM's largest multiblock carrier size (lmbcs) and smallest multiblock carrier size (smbcs) to specify allocation strategies regarding the carrier sizes to be used. -
Cache Hit Rate: recon_alloc:cache_hit_rates()
Cache can be tweaked using three VM flags:
+MMmcs,+MMrmcbf, and+MMamcbf.
== ETS ==
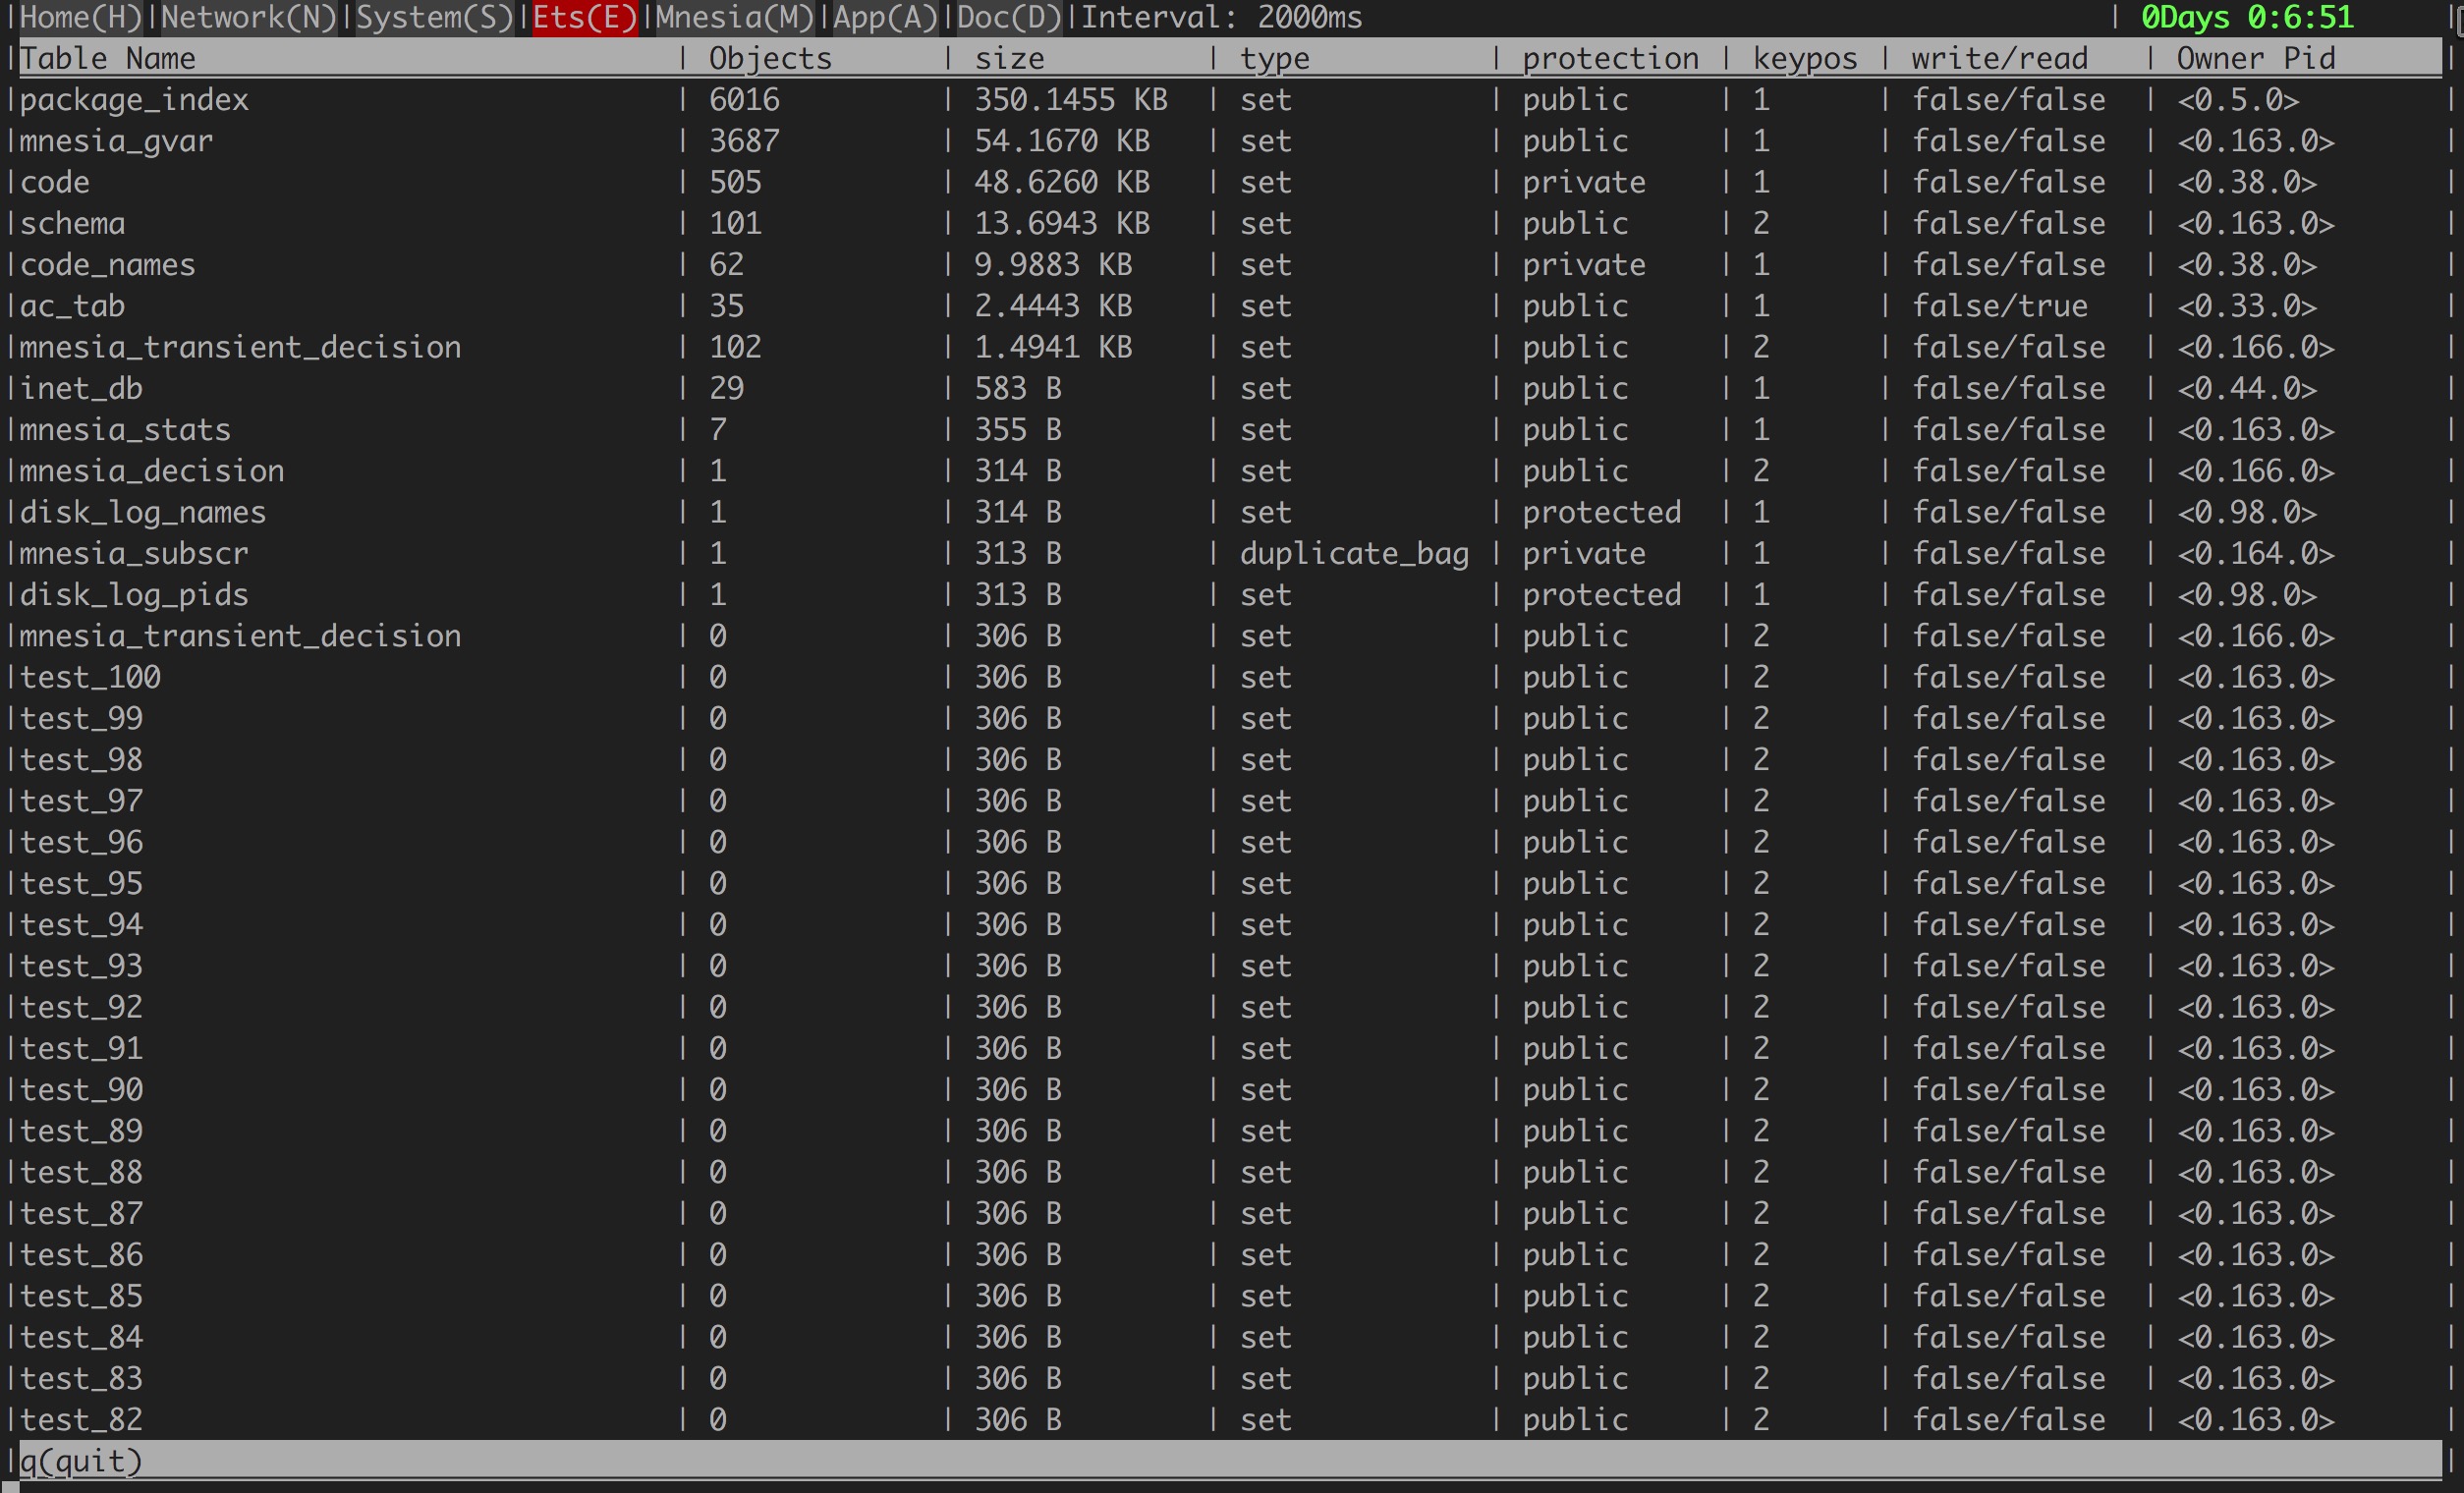 ETS tables are never garbage collected, and will maintain their memory usage as long as
records will be left undeleted in a table. Only removing records manually (or deleting the
table) will reclaim memory.
ETS tables are never garbage collected, and will maintain their memory usage as long as
records will be left undeleted in a table. Only removing records manually (or deleting the
table) will reclaim memory.
Top N list sort by memory size, all items defined in ets:info/2
== Mnesia ==

Top N list sort by memory size, all items defined in mnesia:table_info/2
== Application ==
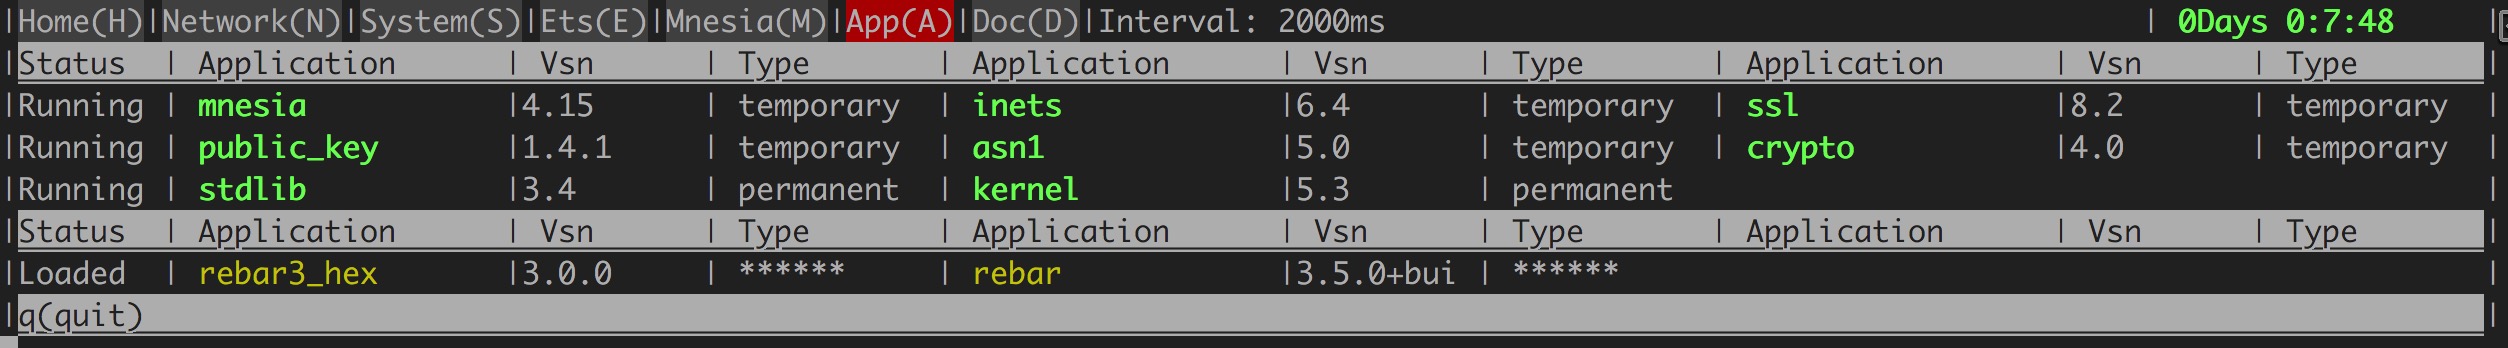
Find application debug information by application_controller:info().