Here is an example of a complex config, declared in its own module.
You can include it like that in your application.ex file:
defmodule MyApp.Application do
  use Application

  def start(_type, _args) do
    import Supervisor.Spec, warn: false

    children = [
      MyApp.Endpoint,
      MyApp.Repo,
      {TelemetryUI, MyApp.TelemetryUI.config()}
    ]

    opts = [strategy: :one_for_one, name: MyApp.Supervisor]
    Supervisor.start_link(children, opts)
  end
end
Dynamic Configuration
Instead of calling the config function directly, you can pass it as a reference to enable hot-reloading:
# Using module and function tuple (recommended for hot-reload)
{TelemetryUI, config: {MyApp.TelemetryUI, :config}}

# Or using anonymous function
{TelemetryUI, config: fn -> MyApp.TelemetryUI.config() end}
This allows you to reload the configuration at runtime without restarting your application. See guides/hot-reload.md for more details.
The config
defmodule MyApp.TelemetryUI do
import TelemetryUI.Metrics
def config do
ui_options = [metrics_class: "grid-cols-8 gap-4"]
[
metrics: [
{"HTTP", http_metrics(), ui_options: ui_options},
{"GraphQL", graphql_metrics(), ui_options: ui_options},
{"Absinthe", absinthe_metrics(), ui_options: ui_options},
{"Ecto", ecto_metrics(), ui_options: ui_options},
{"System", system_metrics()},
{"Internal (hidden)", internal_metrics(), ui_options: [hidden: true, metrics_class: "grid-cols-2"]}
],
theme: theme(),
backend: backend()
]
end
def http_metrics do
http_keep = &(&1[:route] not in ~w(/metrics /graphql))
[
counter("phoenix.router_dispatch.stop.duration",
description: "Number of requests",
keep: http_keep,
unit: {:native, :millisecond},
ui_options: [class: "col-span-3", unit: " requests"]
),
count_over_time("phoenix.router_dispatch.stop.duration",
description: "Number of requests over time",
keep: http_keep,
unit: {:native, :millisecond},
ui_options: [class: "col-span-5", unit: " requests"]
),
average("phoenix.router_dispatch.stop.duration",
description: "Requests duration",
keep: http_keep,
unit: {:native, :millisecond},
ui_options: [class: "col-span-3", unit: " ms"]
),
average_over_time("phoenix.router_dispatch.stop.duration",
description: "Requests duration over time",
keep: http_keep,
unit: {:native, :millisecond},
ui_options: [class: "col-span-5", unit: " ms"]
),
count_over_time("phoenix.router_dispatch.stop.duration",
description: "HTTP requests count per route",
keep: http_keep,
tags: [:route],
unit: {:native, :millisecond},
ui_options: [unit: " requests"],
reporter_options: [class: "col-span-4"]
),
counter("phoenix.router_dispatch.stop.duration",
description: "Count HTTP requests by route",
keep: http_keep,
tags: [:route],
unit: {:native, :millisecond},
ui_options: [unit: " requests"],
reporter_options: [class: "col-span-4"]
),
average_over_time("phoenix.router_dispatch.stop.duration",
description: "HTTP requests duration per route",
keep: http_keep,
tags: [:route],
unit: {:native, :millisecond},
reporter_options: [class: "col-span-4"]
),
distribution("phoenix.router_dispatch.stop.duration",
description: "Requests duration",
keep: http_keep,
unit: {:native, :millisecond},
reporter_options: [buckets: [0, 100, 500, 2000]]
)
]
end
defp absinthe_metrics do
absinthe_tag_values = fn metadata ->
operation_name = Enum.map_join(metadata.blueprint.operations, ",", & &1.name)
%{operation_name: operation_name}
end
[
average("absinthe.execute.operation.stop.duration",
description: "Absinthe operation duration",
unit: {:native, :millisecond},
ui_options: [class: "col-span-3", unit: " ms"]
),
average_over_time("absinthe.execute.operation.stop.duration",
description: "Absinthe operation duration over time",
unit: {:native, :millisecond},
ui_options: [class: "col-span-5", unit: " ms"]
),
counter("absinthe.execute.operation.stop.duration",
description: "Count Absinthe executions per operation",
tags: [:operation_name],
tag_values: absinthe_tag_values,
unit: {:native, :millisecond},
),
average_over_time("absinthe.execute.operation.stop.duration",
description: "Absinthe duration per operation",
tags: [:operation_name],
tag_values: absinthe_tag_values,
unit: {:native, :millisecond},
)
]
end
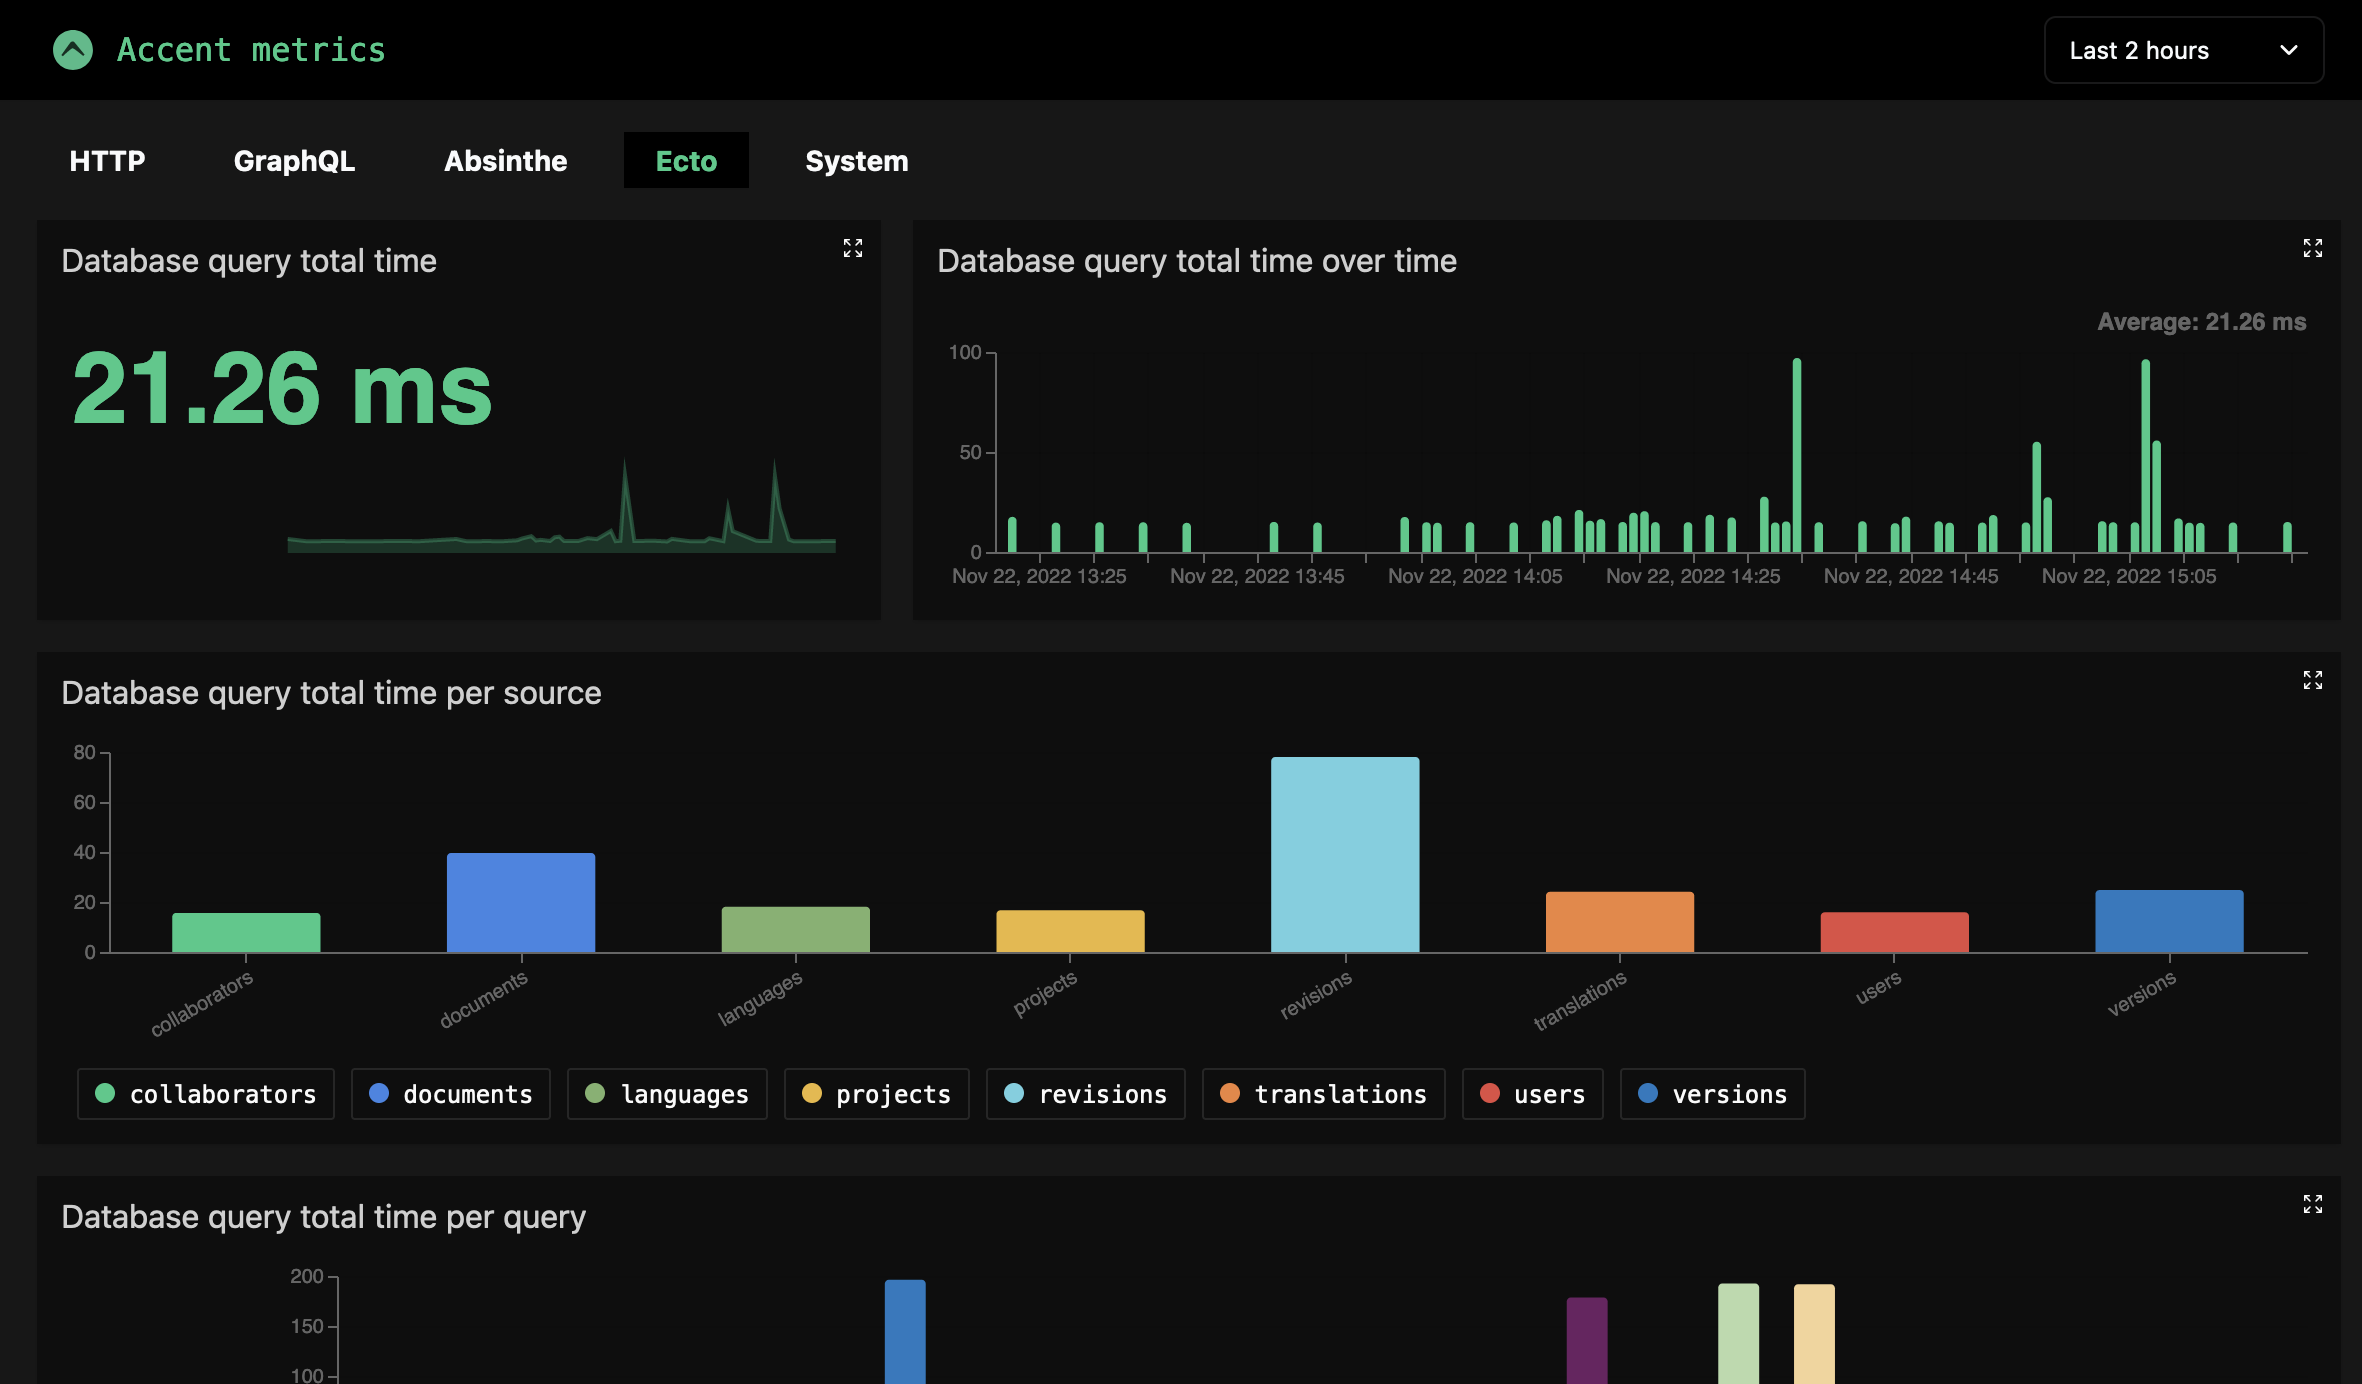
defp ecto_metrics do
ecto_keep = &(&1[:source] not in [nil, ""] and not String.starts_with?(&1[:source], "oban") and not String.starts_with?(&1[:source], "telemetry_ui"))
[
average("myapp.repo.query.total_time",
description: "Database query total time",
keep: ecto_keep,
unit: {:native, :millisecond},
ui_options: [class: "col-span-3", unit: " ms"]
),
average_over_time("myapp.repo.query.total_time",
description: "Database query total time over time",
keep: ecto_keep,
unit: {:native, :millisecond},
ui_options: [class: "col-span-5", unit: " ms"]
),
average("myapp.repo.query.total_time",
description: "Database query total time per source",
keep: ecto_keep,
tags: [:source],
unit: {:native, :millisecond},
ui_options: [class: "col-span-full", unit: " ms"]
)
]
end
defp graphql_metrics do
graphql_keep = &(&1[:route] in ~w(/graphql))
graphql_tag_values = fn metadata ->
operation_name =
case metadata.conn.params do
%{"_json" => json} -> Enum.map_join(json, ",", & &1["operationName"])
_ -> nil
end
%{operation_name: operation_name}
end
[
counter("phoenix.graphql.stop.duration",
event_name: [:phoenix, :router_dispatch, :stop],
description: "Number of GraphQL requests",
keep: graphql_keep,
unit: {:native, :millisecond},
ui_options: [class: "col-span-3", unit: " requests"]
),
count_over_time("phoenix.graphql.stop.duration",
event_name: [:phoenix, :router_dispatch, :stop],
description: "Number of GraphQL requests over time",
keep: graphql_keep,
unit: {:native, :millisecond},
ui_options: [class: "col-span-5", unit: " requests"]
),
average("phoenix.graphql.stop.duration",
event_name: [:phoenix, :router_dispatch, :stop],
description: "GraphQL requests duration",
keep: graphql_keep,
unit: {:native, :millisecond},
ui_options: [class: "col-span-3", unit: " ms"]
),
average_over_time("phoenix.graphql.stop.duration",
event_name: [:phoenix, :router_dispatch, :stop],
description: "GraphQL requests duration over time",
keep: graphql_keep,
unit: {:native, :millisecond},
ui_options: [class: "col-span-5", unit: " ms"]
),
count_over_time("phoenix.graphql.stop.duration",
event_name: [:phoenix, :router_dispatch, :stop],
description: "GraphQL requests count per operation",
keep: graphql_keep,
tag_values: graphql_tag_values,
tags: [:operation_name],
unit: {:native, :millisecond},
ui_options: [unit: " requests"],
reporter_options: [class: "col-span-4"]
),
counter("phoenix.graphql.stop.duration",
event_name: [:phoenix, :router_dispatch, :stop],
description: "Count GraphQL requests by operation",
keep: graphql_keep,
tag_values: graphql_tag_values,
tags: [:operation_name],
unit: {:native, :millisecond},
ui_options: [unit: " requests"],
reporter_options: [class: "col-span-4"]
),
average_over_time("phoenix.graphql.stop.duration",
event_name: [:phoenix, :router_dispatch, :stop],
description: "GraphQL requests duration per operation",
keep: graphql_keep,
tag_values: graphql_tag_values,
tags: [:operation_name],
unit: {:native, :millisecond},
reporter_options: [class: "col-span-4"]
),
distribution("phoenix.graphql.stop.duration",
event_name: [:phoenix, :router_dispatch, :stop],
description: "GraphQL requests duration",
keep: graphql_keep,
unit: {:native, :millisecond},
reporter_options: [buckets: [0, 100, 500, 2000]]
)
]
end
defp system_metrics do
[
last_value("vm.memory.total", unit: {:byte, :megabyte})
]
end
defp internal_metrics do
[
counter("telemetry_ui.some_internal_metric")
]
end
defp theme do
%{
header_color: "#28cb87",
primary_color: "#28cb87",
title: "My app metrics",
share_key: "012345678912345",
logo: """
<svg
viewBox="0 0 480 480"
xmlns="http://www.w3.org/2000/svg"
fill-rule="evenodd"
clip-rule="evenodd"
stroke-linejoin="round"
stroke-miterlimit="1.414"
width="20"
height="20"
>
<circle cx="240" cy="240" r="239.334" fill="#3dbc87" />
<path
d="M101.024 300.037l16.512 14.677s100.856-96.196 117.42-96.445c16.562-.25 126.59 92.77 126.59 92.77l17.43-15.6-116.5-142.19c-8.257-11.01-18.348-16.51-27.52-16.51-11.927 0-23.852 8.25-34.86 24.77l-99.072 138.52z"
fill="#0f2f21"
fill-rule="nonzero"
/>
</svg>
"""
}
end
defp backend do
%TelemetryUI.Backend.EctoPostgres{
repo: MyApp.Repo,
pruner_threshold: [months: -1],
pruner_interval_ms: 84_000,
max_buffer_size: 10_000,
flush_interval_ms: 30_000,
verbose: false
}
end
endPage UI Options
Each page (metrics group) supports the following ui_options:
metrics_class
Controls the grid layout for metrics within a page. Default is "grid-cols-1 md:grid-cols-3 gap-4".
{"HTTP", http_metrics(), ui_options: [metrics_class: "grid-cols-8 gap-4"]}All TailwindCSS grid classes are available with responsive variants (sm:, md:, lg:).
hidden
Hides the page from the navigation and main view. Useful for internal metrics or pages you want to keep but not display.
{"Internal", internal_metrics(), ui_options: [hidden: true]}styles
Adds custom CSS styles to the page container.
{"Debug", debug_metrics(), ui_options: [styles: "background-color: #f0f0f0; padding: 20px;"]}