Installation
View SourceObserver Web is delivered as a hex package named observer_web. The package is entirely self contained—it
doesn't hook into your asset pipeline.
There are three installation mechanisms available:
- Semi-Automatic Installation using an igniter powered mix task
- Igniter Installation fully automatic installation using igniter
- Manual Installation add Observer Web and handle all steps manually
Semi-Automatic Installation
You can use the observer_web.install task without the igniter.install escript available.
First, add observer_web and igniter to your deps in mix.exs:
{:observer_web, "~> 0.2.0"},
{:igniter, "~> 0.5", only: [:dev]},
Run mix deps.get to fetch observer_web, then run the install task:
mix observer_web.install
This will automate all of the manual setup steps for you!
Igniter Installation
For projects that have [igniter][igniter] available, Observer Web can be installed and configured with a single command:
mix igniter.install observer_web
that will add the latest version of observer_web to your dependencies before running the installer,
then mount it as /observer within the :dev_routes conditional.
Manual Installation
Before installing Observer Web, ensure you have:
- Phoenix Live View - Ensure Phoenix Live View is installed and working. If you don't have Live View yet, follow these instructions.
Add observer_web as a dependency for your application. Open mix.exs and add the following line:
{:observer_web, "~> 0.2.0"}Now fetch your dependencies:
mix deps.get
This will fetch observer_web.
After fetching the package you'll use the Observer.Web.Router to mount the dashboard within your
application's router.ex:
# lib/my_app_web/router.ex
use MyAppWeb, :router

import Observer.Web.Router

...

scope "/" do
  pipe_through :browser

  observer_dashboard "/observer"
end
Here we're using "/observer" as the mount point, but it can be anywhere you like. See the
Observer.Web.Router docs for additional options.
Embedding Observer Web in your app page
In some cases, you may prefer to run the Observer in the same page as your app rather than in
a separate page. This embedded approach is possible by setting the iframe flag. To implement
this, your router must add a root path. Here's an example for your application's router.ex:
# lib/my_app_web/router.ex
use MyAppWeb, :router

import Observer.Web.Router

...

scope "/" do
  pipe_through :browser

  live_session :require_authenticated_user,
    on_mount: [{MyAppWeb.UserAuth, :ensure_authenticated}] do
    ...
    live "/embedded-observer", ObserverLive, :index
    ...
  end

  observer_dashboard "/observer"
end
Next, create an ObserverLive file at live/observer/index.ex:
defmodule MyAppWeb.ObserverLive do
  @moduledoc """
  """
  use MyAppWeb, :live_view

  @impl true
  def render(assigns) do
    ~H"""
    <div>
      <iframe src={~p"/observer/tracing?iframe=true"} class="min-h-screen" width="100%" height="100%" title="Observer Web">
      </iframe>
    </div>
    """
  end

  @impl true
  def mount(_params, _session, socket) do
    {:ok, socket}
  end

  @impl true
  def handle_params(params, _url, socket) do
    {:noreply, apply_action(socket, socket.assigns.live_action, params)}
  end

  defp apply_action(socket, :index, _params) do
    socket
    |> assign(:page_title, "Observer Web")
  end
end
You can still access the Observer as a separate page by navigating directly to the
path /observer". However, using the iframe approach allows you to display
your application's information alongside the Observer in your main page,
providing a more integrated monitoring experience.
Clustering Required
The Observer Web requires your app to be clustered. Otherwise, observability will only be available on the current node.
Post-Installation
After installation (by any method), you should consider the following configuration steps:
Secure Dashboard Access
After you've verified that the dashboard is loading you'll probably want to restrict access to the dashboard via authentication, either with a custom resolver's access controls or Basic Auth.
Customize the Dashboard
Web customization is done through the Observer.Web.Resolver behaviour. It allows you to enable
access controls, control formatting, and provide query limits for filtering and searching. Using a
custom resolver is optional, but you should familiarize yourself with the default limits
and functionality.
Metrics
1. Retention period for metrics
Observer Web can monitor Beam VM metrics (along with many others) and uses ETS tables to store the data and there is a possibility of configuration for the retention period while the application is running.
By default, without a retention time set, the metrics will only show data received during the current session. If you'd like to persist this data for a longer period, you can configure a retention time.
To configure the retention period, use the following optional setting:
config :observer_web,
  data_retention_period: :timer.minutes(30)
Persistence Across Restarts
Please note that data is not persisted across application restarts. For persistent storage, refer to the Configuration section to set up a Central Hub application, which can aggregate and retain metrics.
2. Configuration
Observer Web can operate in two distinct metrics configurations: Standalone and Metric Hub.
These configurations determine how metrics are collected, stored, and managed.
Standalone Configuration (default)
In this mode, all applications with Observer Web installed operate independently. Each application receives and stores its own metrics within its ETS tables. The image below illustrates this configuration:
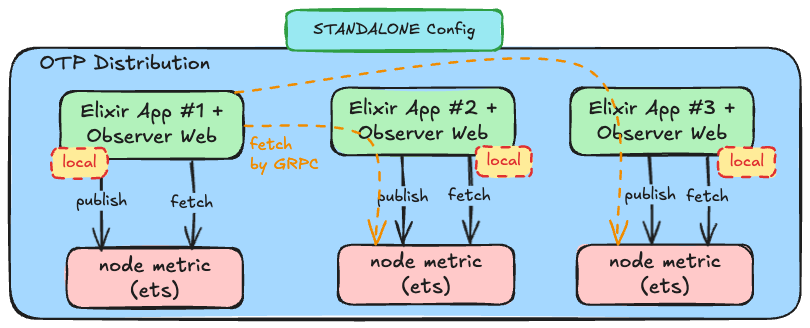
NOTE: No additional configuration is required for this mode
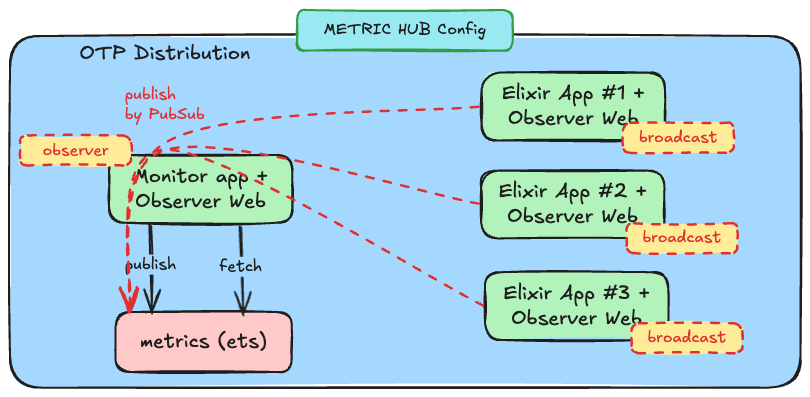
Metric Hub Configuration
In this mode, one application is designated as the central hub to store all metrics, while the remaining applications broadcast their data to this designated hub. This configuration is ideal for scenarios where you have a dedicated application for monitoring or deployment, such as DeployEx. Additionally, this setup ensures that metrics are retained even if any of the monitored applications restart.
To configure applications to broadcast their metrics, use the following setting:
config :observer_web,
  mode: :broadcast
Disable Endpoint for Broadcast applications
In this mode, since there is a centralized application dedicated to capturing metrics, we recommend disabling the
/observerendpoint on all applications configured in broadcast mode. Only the central observer (hub) should expose the/observerendpoint to avoid redundancy and ensure efficient metric collection.
To designate an application as the central observer (hub), use the following setting:
config :observer_web,
  mode: :observer,
  data_retention_period: :timer.minutes(30)
The application in observer mode will also retain its own metrics in addition to
aggregating metrics from other applications.
3. Metrics Polling Interval
Observer Web allows configuration of some polling intervals:
- Phoenix Liveview sockets - Default:
5_000ms - Beam VM statistics (total memory, queues, etc) - Default:
1_000ms - Beam VM Process/Port memory statistics (total, stack, heap, etc) - Default:
1_000ms
config :observer_web,
  phx_lv_sckt_poller_interval_ms: 5_000,
  beam_vm_poller_interval_ms: 1_000
  beam_vm_process_port_poller_interval_ms: 1_000
For applications running by DeployEx
When using DeployEx, the BEAM VM statistics polling is also used to monitor and, if necessary, restart the application. The polling interval directly affects how quickly these actions are performed. While ports, atoms, and processes are configured via Observer Web, the memory check interval (also used by DeployEx) is configured separately—refer to the relevant documentation for details.
Usage with Web and Clustering
The Observer Web provides observer ability for the local application as well as any other that is clustered.
Customization
Web customization is done through the Observer.Web.Resolver behaviour. It allows you to enable
access controls. Using a custom resolver is entirely optional, but you should familiarize yourself
with the default limits and functionality.
Installation is complete and you're all set! Start your Phoenix server and enjoy the observability via OTP distribution!