Plug.Telemetry.ServerTiming
This library provides support for Server-Timing header in Plug
applications by exposing Telemetry events as metrics in HTTP headers. This
allows developers to use their's browser DevTools to display server metrics in
readable way.
Installation
The package can be installed by adding plug_server_timing to your list of
dependencies in mix.exs:
def deps do
  [
    {:plug_telemetry_server_timing, "~> 0.1.0"}
  ]
end
Then add Plug.ServerTiming to your pipeline BEFORE any Plug.Telemetry
definitions:
plug Plug.Telemetry.ServerTiming
plug Plug.Telemetry, event_prefix: [:my, :plug]
And then you need to install metrics you will want to see in the DevTools:
Plug.Telemetry.ServerTiming.install([
  {[:my, :plug, :stop], :duration}
])
Now when you will open given page in browsers with support for
Server-Timing you will be able to see the data in DevTools, example
in Google Chrome:
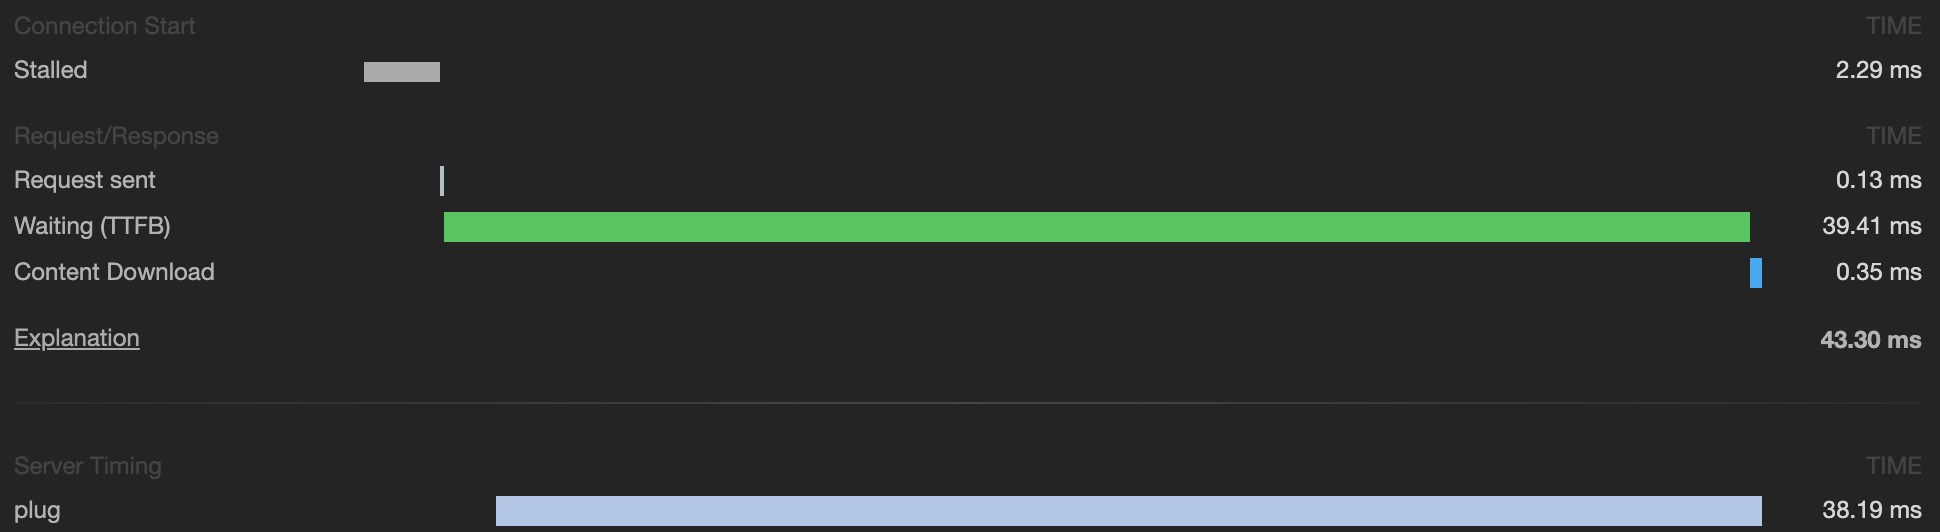
WARNING
Current specification of Server-Timing do not provide a way to specify event
start time, which mean, that the data displayed in the DevTools isn't trace
report (like the content of the "regular" HTTP timings) but raw dump of the data
displayed as a bars. This can be a little bit confusing, but right now there is
nothing I can do about it.
License
MIT License