Ewebmachine.Plug.Debug (ewebmachine v2.3.3)
View SourceA ewebmachine debug UI at /wm_debug
Add it before Ewebmachine.Plug.Run in your plug pipeline when you
want debugging facilities.
if Mix.env == :dev, do: plug Ewebmachine.Plug.DebugThen go to http://youhost:yourport/wm_debug, you will see the
request list since the launch of your server. Click on any to get
the ewebmachine debugging UI. The list will be automatically
updated on new query.
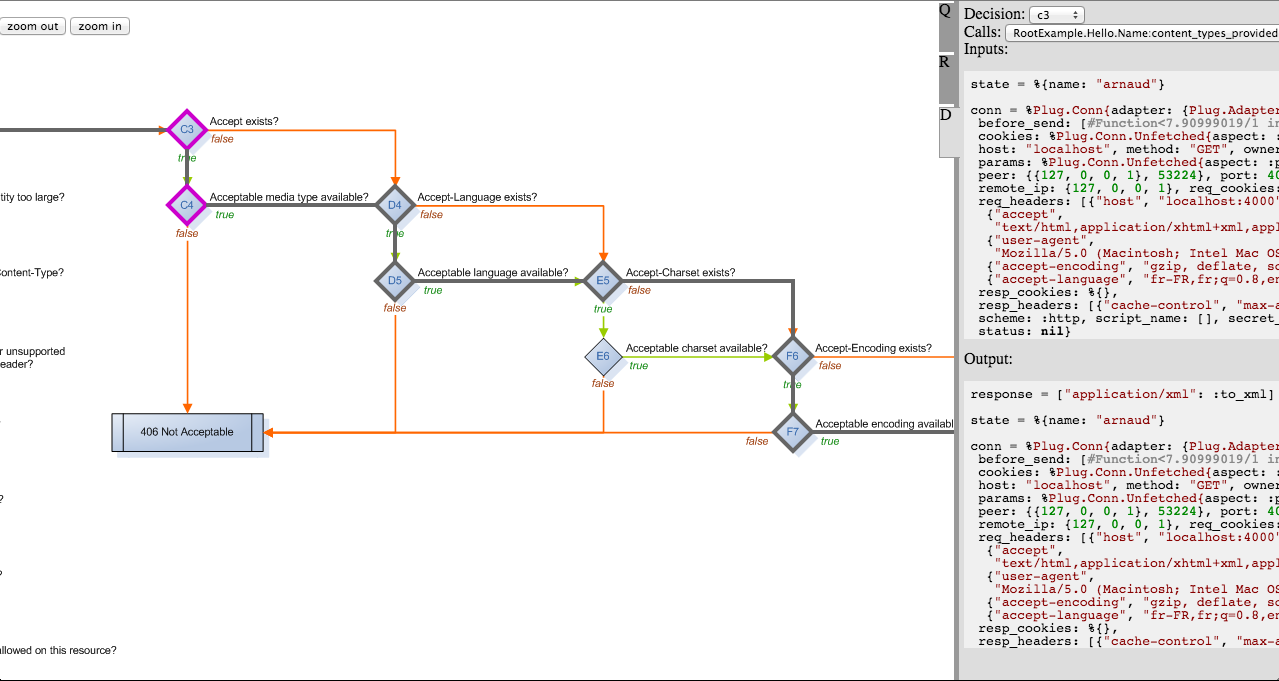
The ewebmachine debugging UI
- shows you the HTTP decision path taken by the request to the response. Every
- the red decisions are the one where decisions differs from the
default one because of a handler implementation :
- click on them, then select any handler available in the right
tab to see the
conn,stateinputs of the handler and the response.
- click on them, then select any handler available in the right
tab to see the
- The response and request right tab shows you the request and result at the end of the ewebmachine run.
- click on "auto redirect on new query" and at every request, your browser will navigate to the debugging UI of the new request (you can still use back/next to navigate through requests)
Summary
Functions
Callback implementation for Plug.call/2.
Callback implementation for Plug.init/1.