Debugging WebRTC
View SourceWebRTC is a complex technology with a lot of moving pieces under the hood, which can make dealing with issues very challenging. Fortunately, there are quite a lot of tools and techniques created to make this process a bit easier.
In this tutorial, we will go through some of the methods you can use to debug WebRTC.
WebRTC Internals
If you're using a Chromium-based web browser, you're in luck. Chromium provides WebRTC Internals - a page with WebRTC stats
about currently used PeerConnections. Access the address chrome://webrtc-internals to see something like this:
The visual aspects may not knock you off your feet, but the page provides a lot of useful information and stats. Check out this blog post to learn more about what's in the WebRTC Internals, or simply explore the tool and see what you find useful.
Other browsers
Chromium's WebRTC Internals is arguably the best tool of this kind. Firefox provides about:webrtc page, but it's not nearly as featureful as chrome://webrtc-internals.
Safari does not have an equivalent, but it allows you to enable verbose logging of WebRTC-related stuff.
Elixir WebRTC Dashboard
While Chromium's chrome://webrtc-internals provides you with stats about PeerConnection in the browser, Elixir WebRTC has its dashboard.
It is an extension of Phoenix LiveDashboard and can be added with a few lines of code to your Phoenix
project. It provides information about the PeerConnection state, ICE candidates, inbound and outbound RTP, etc. It is not as rich as the WebRTC Internals but still may
be very helpful when debugging.
We won't go through each of the sections - if you're familiar with WebRTC Internals, you'll feel right at home in the Elixir WebRTC dashboard.
Turning on logs in Chromium
Sometimes it's also worth taking a look at browser logs - specific errors may tell you more than just graphs in WebRTC Internals.
To turn on logs in Chromium, you can use
chromium --enable-logging='stderr' --vmodule='*/webrtc/*=2'
where chromium is either your Chrome or Chromium binary. The vmodule option will filter the logs to only WebRTC-related stuff.
The amount of logs can be a little overwhelming - just try to look for keywords related to your problem.
Dumping raw RTP packets from Chromium
In case of very cryptic issues, you might be tempted to inspect the RTP packets received by the browser. The obvious choice would be to just open up Wireshark and capture the RTP traffic directly. Unfortunately, WebRTC by design encrypts all of the RTP data, so the amount of information you can obtain from packets captured live is highly limited. There are two solutions:
run Chromium with
--disable-webrtc-encryptionflag. In this case, the other WebRTC peer also needs to somehow bypass encryption, which (as of now) is impossible in Elixir WebRTC.make Chromium dump received RTP packets after they were decrypted.
If you're using Elixir WebRTC, only the second option is viable, and arguably, a bit easier. To make Chromium dump the RTP packets, run it with
chromium --enable-logging=stderr -v=3 --force-fieldtrials=WebRTC-Debugging-RtpDump/Enabled/ > log.txt 2>&1
This will save logs mixed up with RTP packets to log.txt. We need to filter out non-RTP stuff with
grep RTP_DUMP log.txt > rtp-dump.txt
We can use the text2pcap utility (which comes with Wireshark) to convert the logs to .pcap file
text2pcap -D -u 5443,62132 -t %H:%M:%S.%f rtp-dump.txt rtp-dump.pcap
Now, you should be able to open the rtp-dump.pcap file with Wireshark and inspect the packets!
What about Firefox?
You can also do similar things in Firefox. Check out this SO post to learn how to turn on WebRTC logs, and this blog post on how to dump RTP packets.
FAQ
This section contains a bunch of questions related to something not working when using Elixir WebRTC or WebRTC in general. Some of them can be diagnosed with the techiniques described earlier in this tutorial and can be remedied with simple fixes.
1. I'm sending data from Elixir WebRTC to a browser, but my HTML video element is loading infinitely and not showing the video.
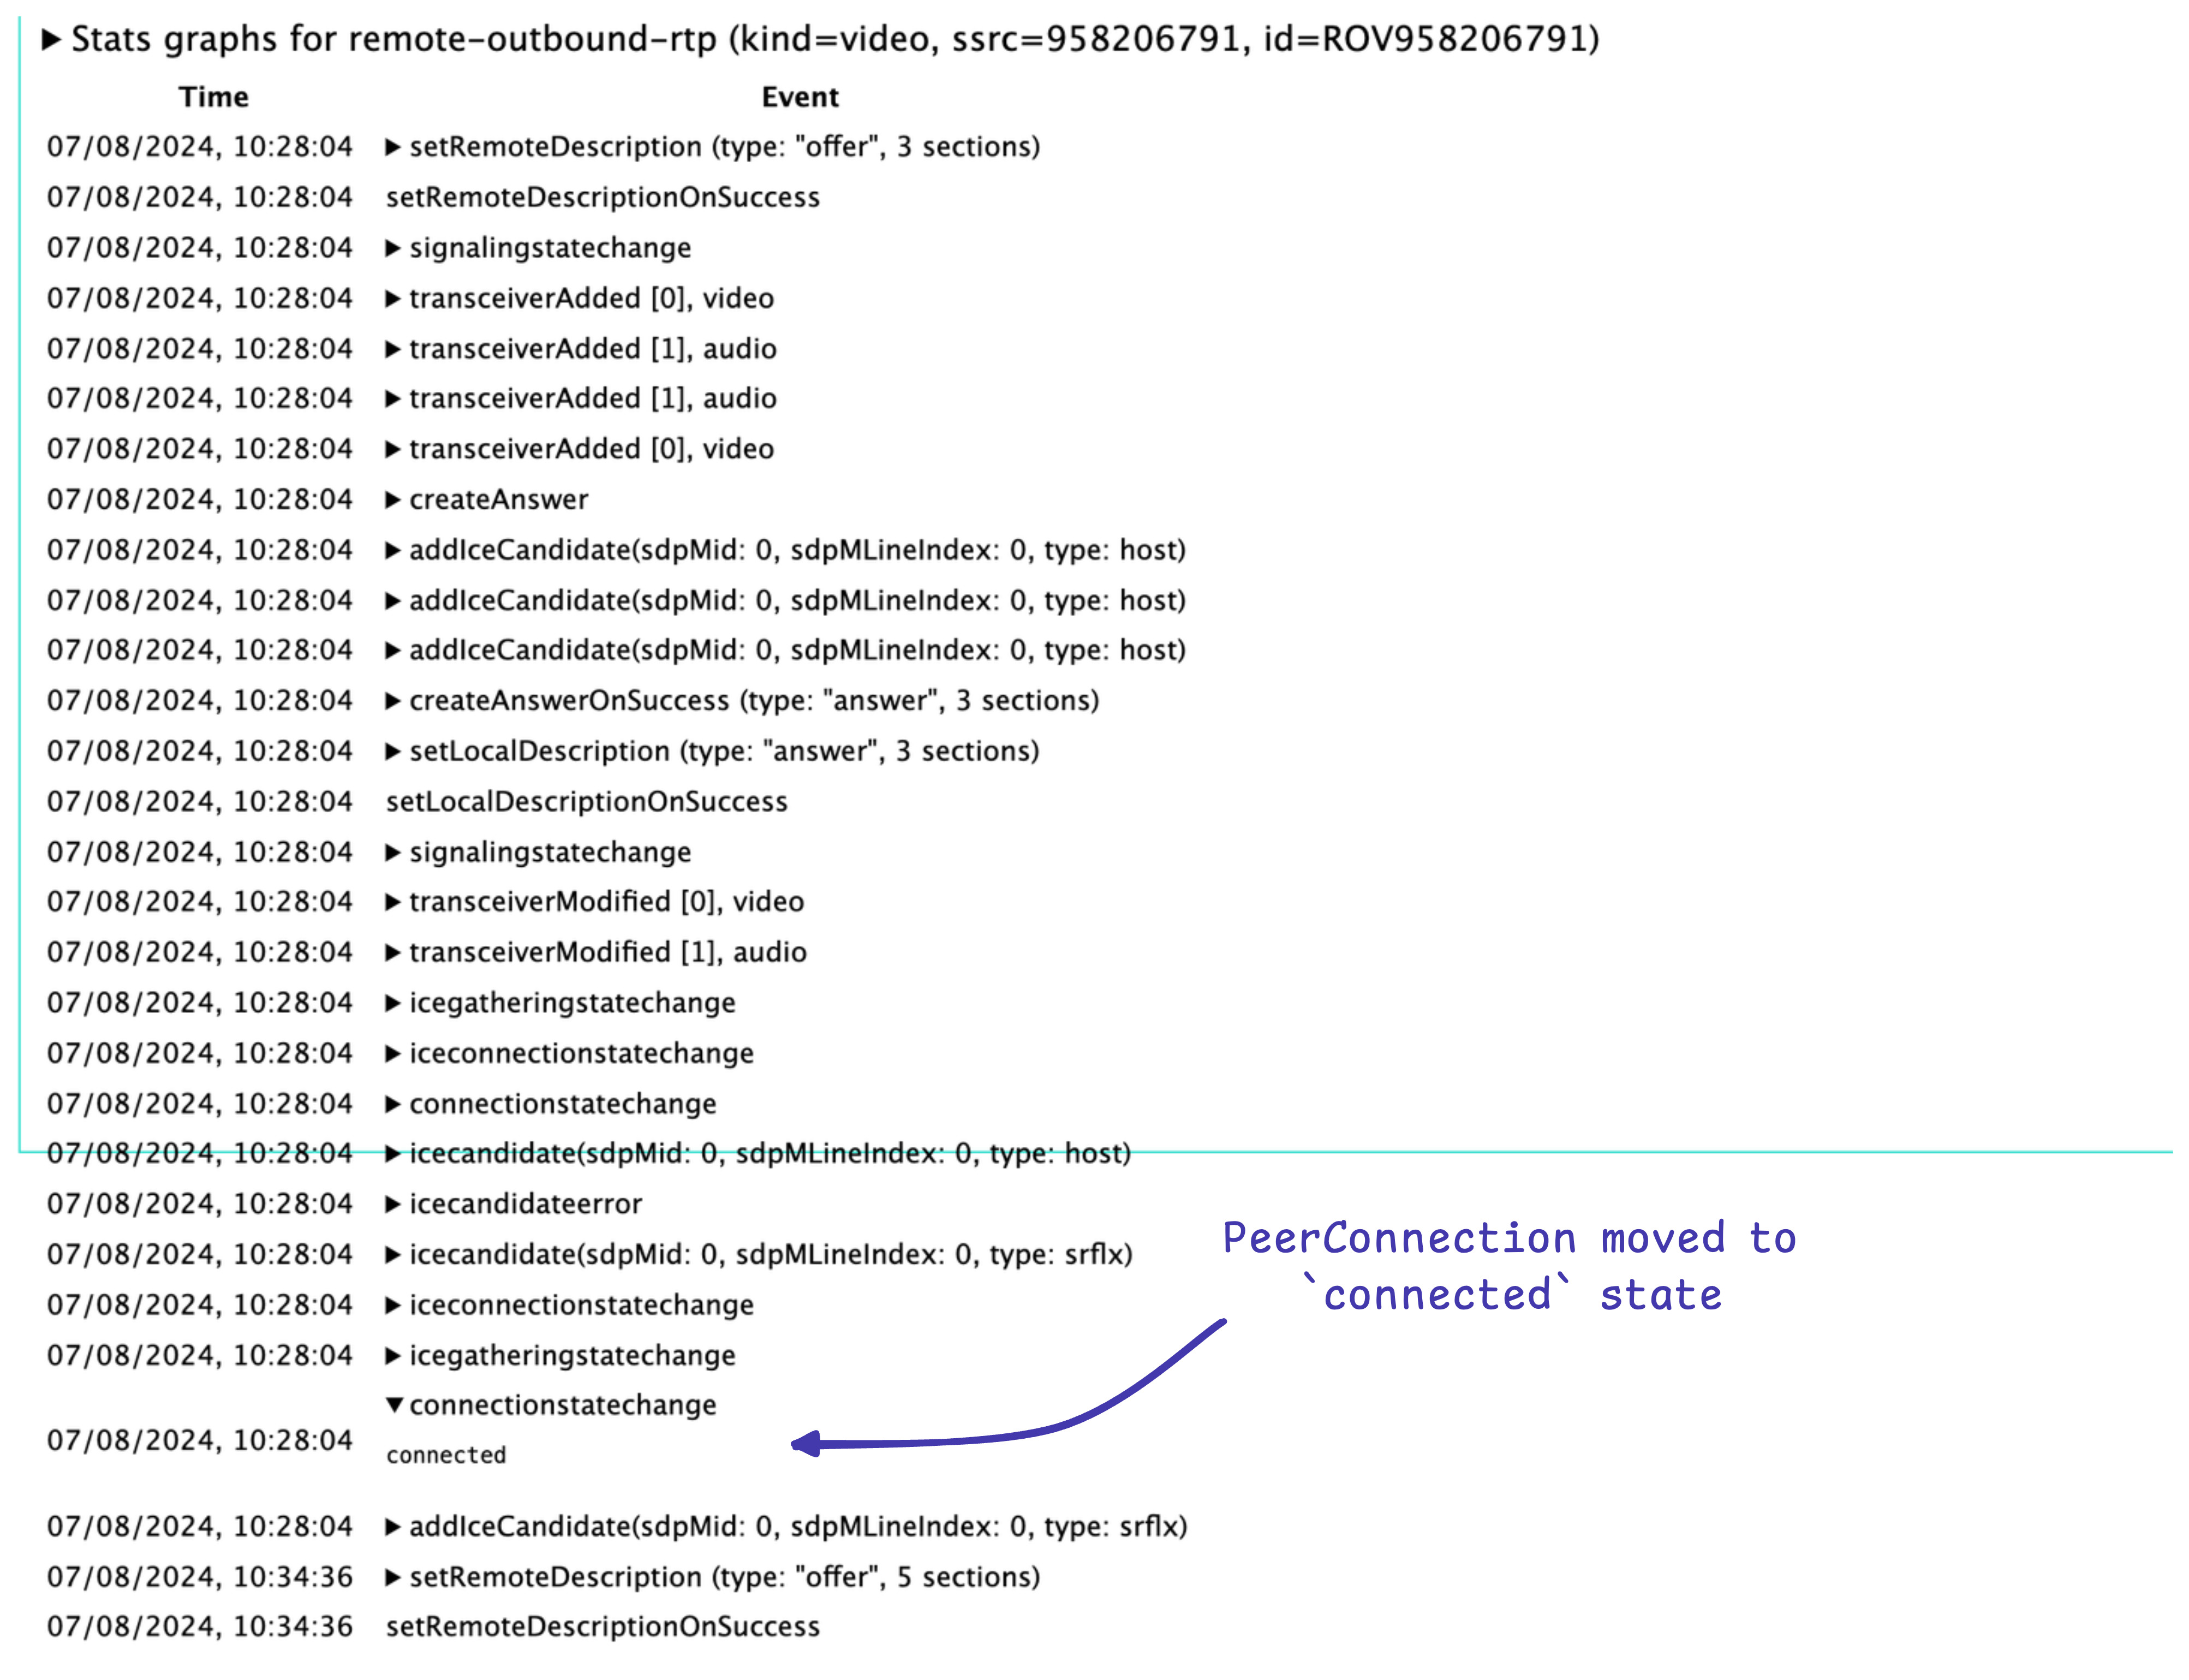
Firstly, take a look at chrome://webrtc-internals. Make sure that there's nothing marked with a red background in the API trace section, and that
your PeerConnection is in the connected state. Find the inbound-rtp section (either table with stats or graphs, the graph section
will be called Stats graphs for inbound-rtp (kind=video, mid=2, ...)) related to your track.
If you cannot find the inbound-rtp section, make sure you properly added and negotiated the tracks. The SDP offer and answer can be inspected in the API trace section of
chrome://webrtc-internals.
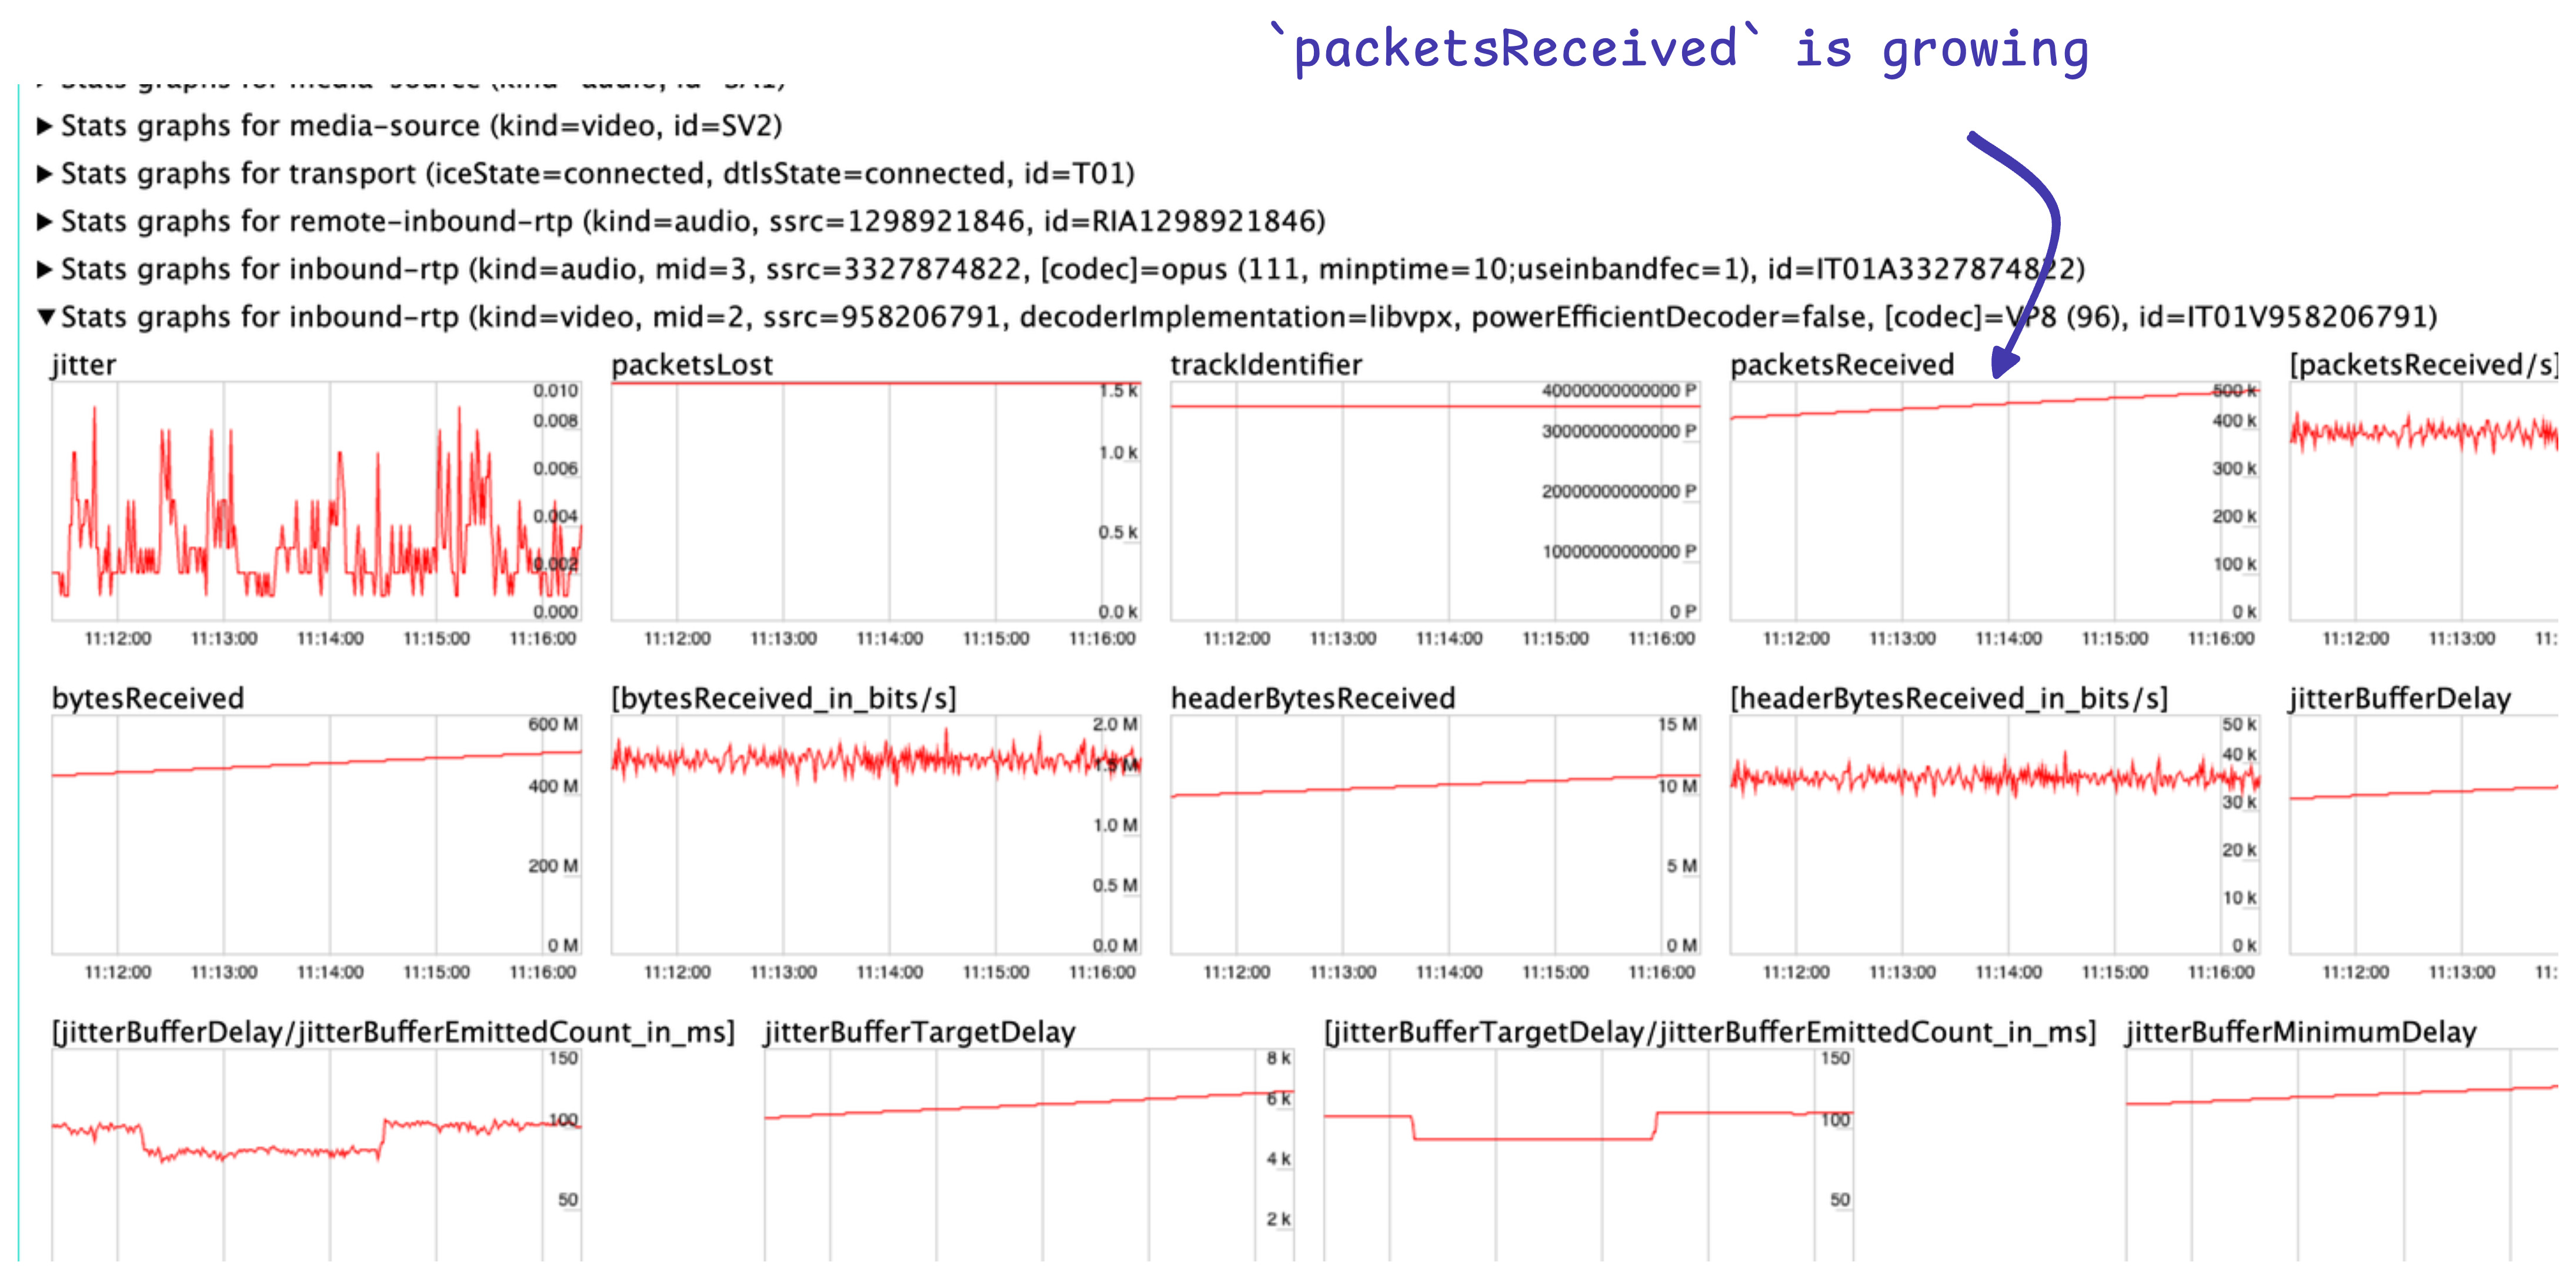
Assuming you have found your inbound-rtp section, take a look at packetsReceived graph.
1. packetsReceived not growing
If it's 0 and not growing, the transceiver is not getting packets at all or rejecting the packets.
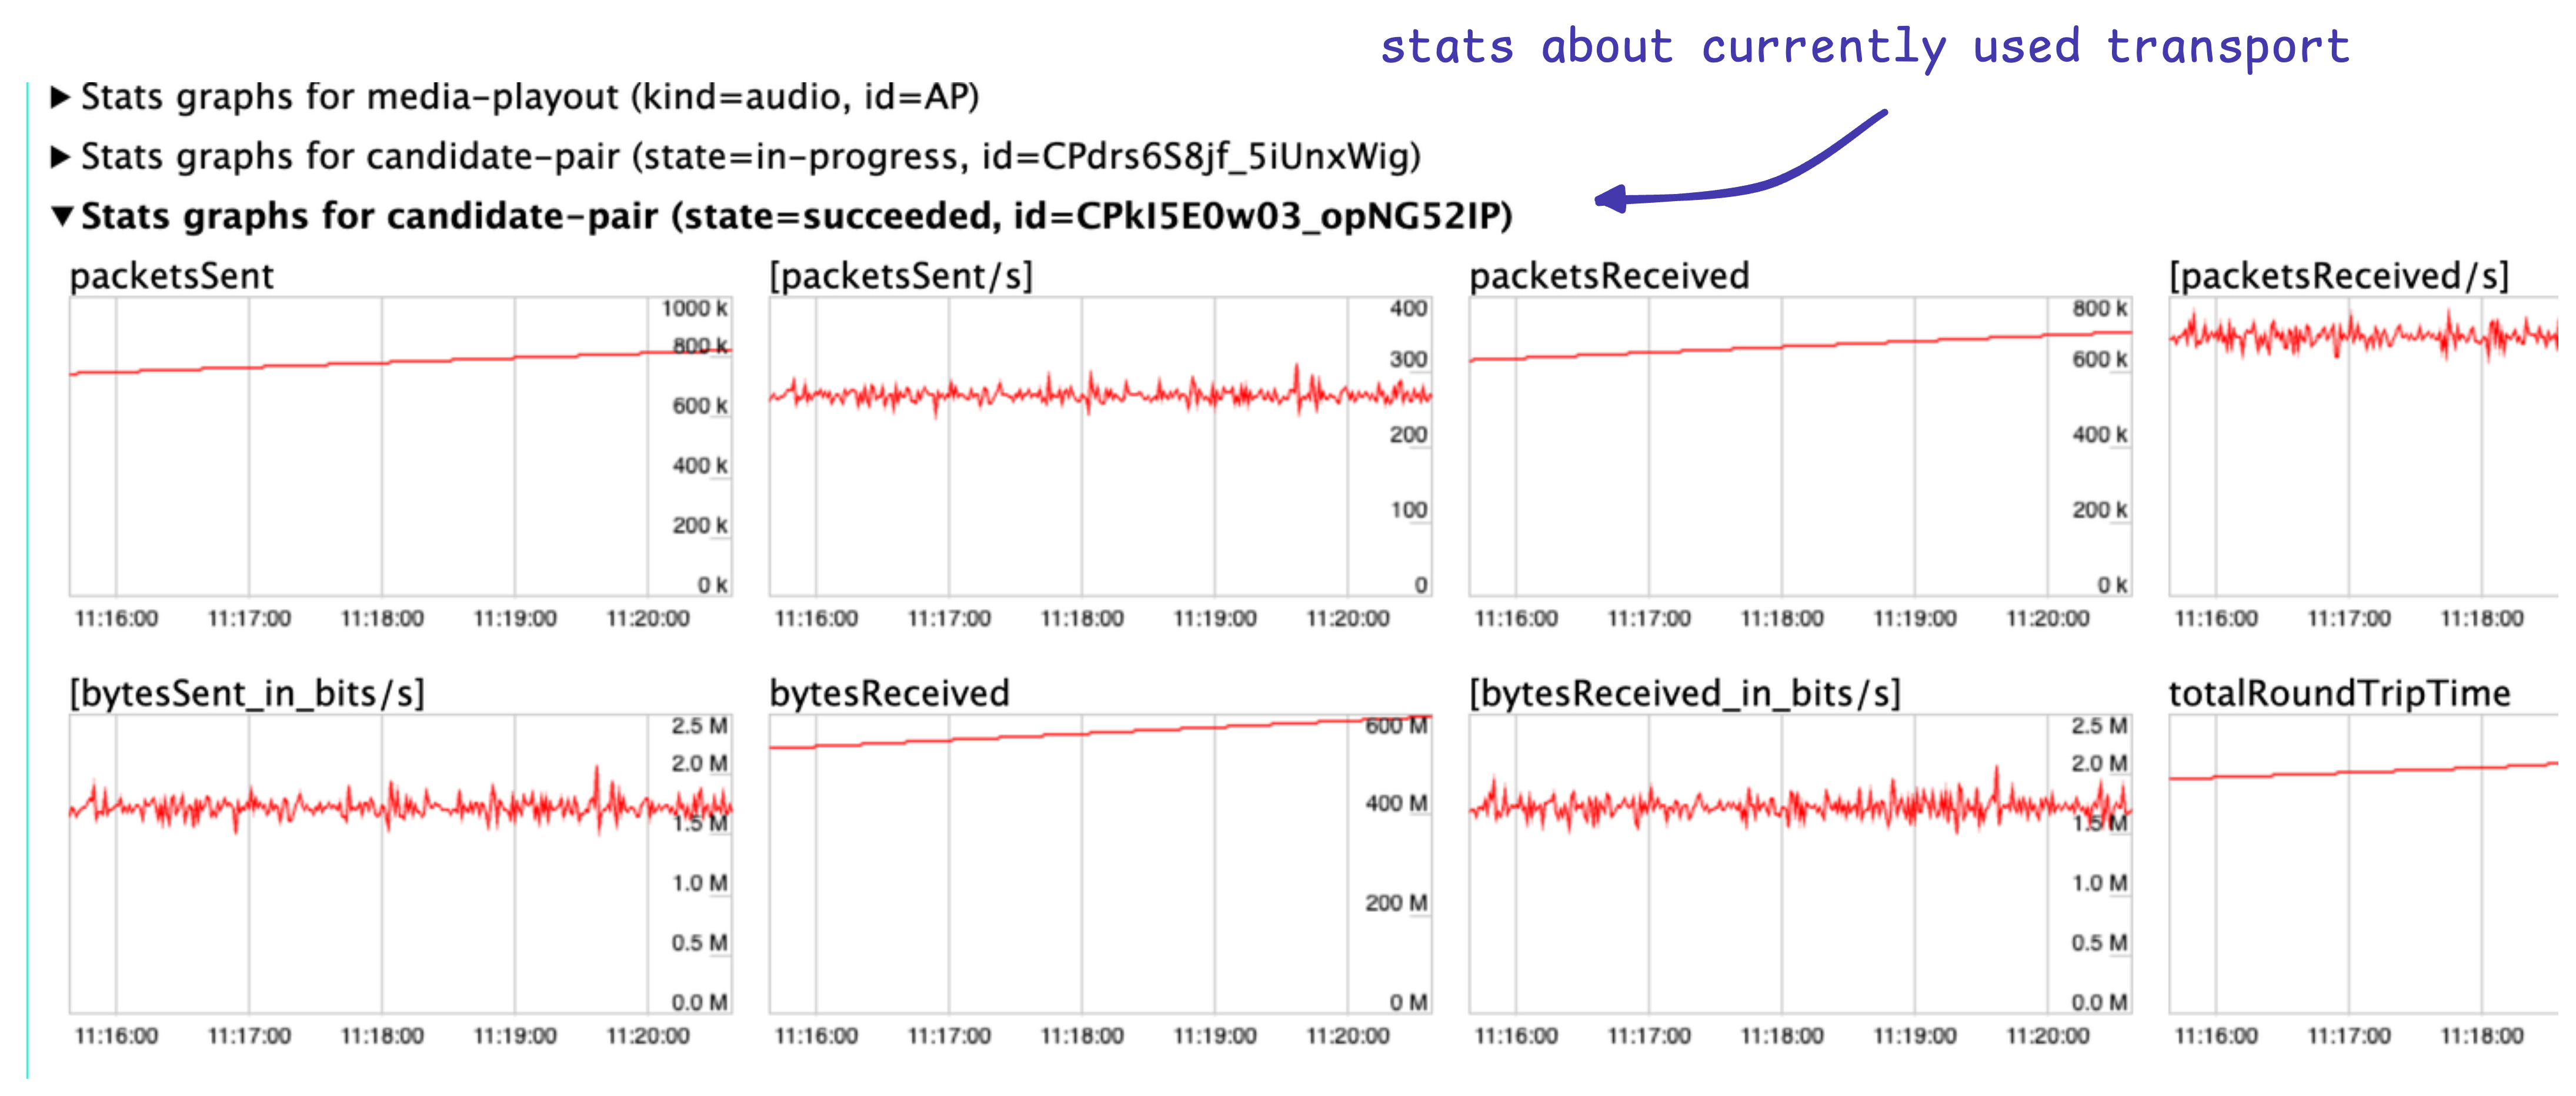
Take a look at Stats graphs for candidate-pair (state=succeeded, id=XXX) (the one in bold) section and find packetsReceived. Assuming that you multiplex all WebRTC data
on a single transport (which is always the case for Elixir WebRTC), this stat shows all of the packets received by the PeerConnection. If it's not growing, once again
make sure your PeerConnection is in a connected state and you're sending packets properly on the Elixir WebRTC end. If it's growing, the issue is with the transceiver rejecting
the packets.
A common issue in this case is an invalid direction of the transceiver you're trying to receive data on. If the direction is sendonly or inactive, the
transceiver will drop all of the incoming packets. For instance, creating a recvonly transceiver and performing a negotiation will result in a transceiver with inactive
direction (not sendonly!) on the remote peer, which might be counterintuitive. Make sure you properly negotiated the session by inspecting the SDP offers and answers.
If you're sure that the session was properly negotiated, reproduce the issue, create an RTP dump, and share it with us - this might be an Elixir WebRTC bug.
2. packetsReceived growing, but framesDecoded stays on 0 (in case of video)
If packets are received, but the framesDecoded stat stays on 0 (and/or framesDropped stat is growing), the issue is either with invalid media data (unlikely, if
you're just forwarding the media data) or with the lack of a keyframe. In such a case, take a look at the keyFramesDecoded stat (if it stays on 0, no keyframes were received)
and the pliCount stat. If it's growing indefinitely, the other peer is ignoring keyframe requests (more specifically, PLI - Picture Loss Indication). Make sure you're properly
handling PLI on the remote PeerConnection, or that you produce a keyframe periodically.
The issues also might be caused by the fact that you're trying to send RTP packets with an invalid codec. For instance, you're wanted to negotiate H264, but it was rejected (and you did not realize that), and now you're trying to send H264, Elixir WebRTC will assign some unrelated payload type to the packets. The browser obviously won't be able to decode that.
2. Some of my Simulcast layers are not sent at all.
When using Simulcast in a browser, make sure that you allocate not too little bandwidth for the resolution of the Simulcast layers. Otherwise, if the browser deems that there is too little bandwidth available, or that the CPU load is too big, it might decide to just stop sending one of the layers.
mediaConstraints = {video: {width: { ideal: 1280 }, height: { ideal: 720 } }, audio: true};
const localStream = await navigator.mediaDevices.getUserMedia(mediaConstraints);

const pc = new RTCPeerConnection();
pc.addTransceivers(localStream.getVideoTracks()[0], {
  sendEncodings: [
    { rid: "h", maxBitrate: 1200 * 1024},
    { rid: "m", scaleResolutionDownBy: 2, maxBitrate: 600 * 1024},
    { rid: "l", scaleResolutionDownBy: 4, maxBitrate: 300 * 1024 },
  ],
});
You can take a look at this snippet
from libwebrtc to have an idea of what values should you use.
3. Firewall
When using Elixir WebRTC, make sure you open the ephemeral range of UDP ports in your firewall. WebRTC uses a random port in this range, one for every PeerConnection. You can also configure PeerConnection to use a specific port range by doing
{:ok, pc} = ExWebRTC.PeerConnection.start(ice_port_range: 50_000..50_100)Otherwise, the connection won't be established at all, or just in one direction.
Read more in our Deploying tutorial!