View Source Dashboards Screenshots
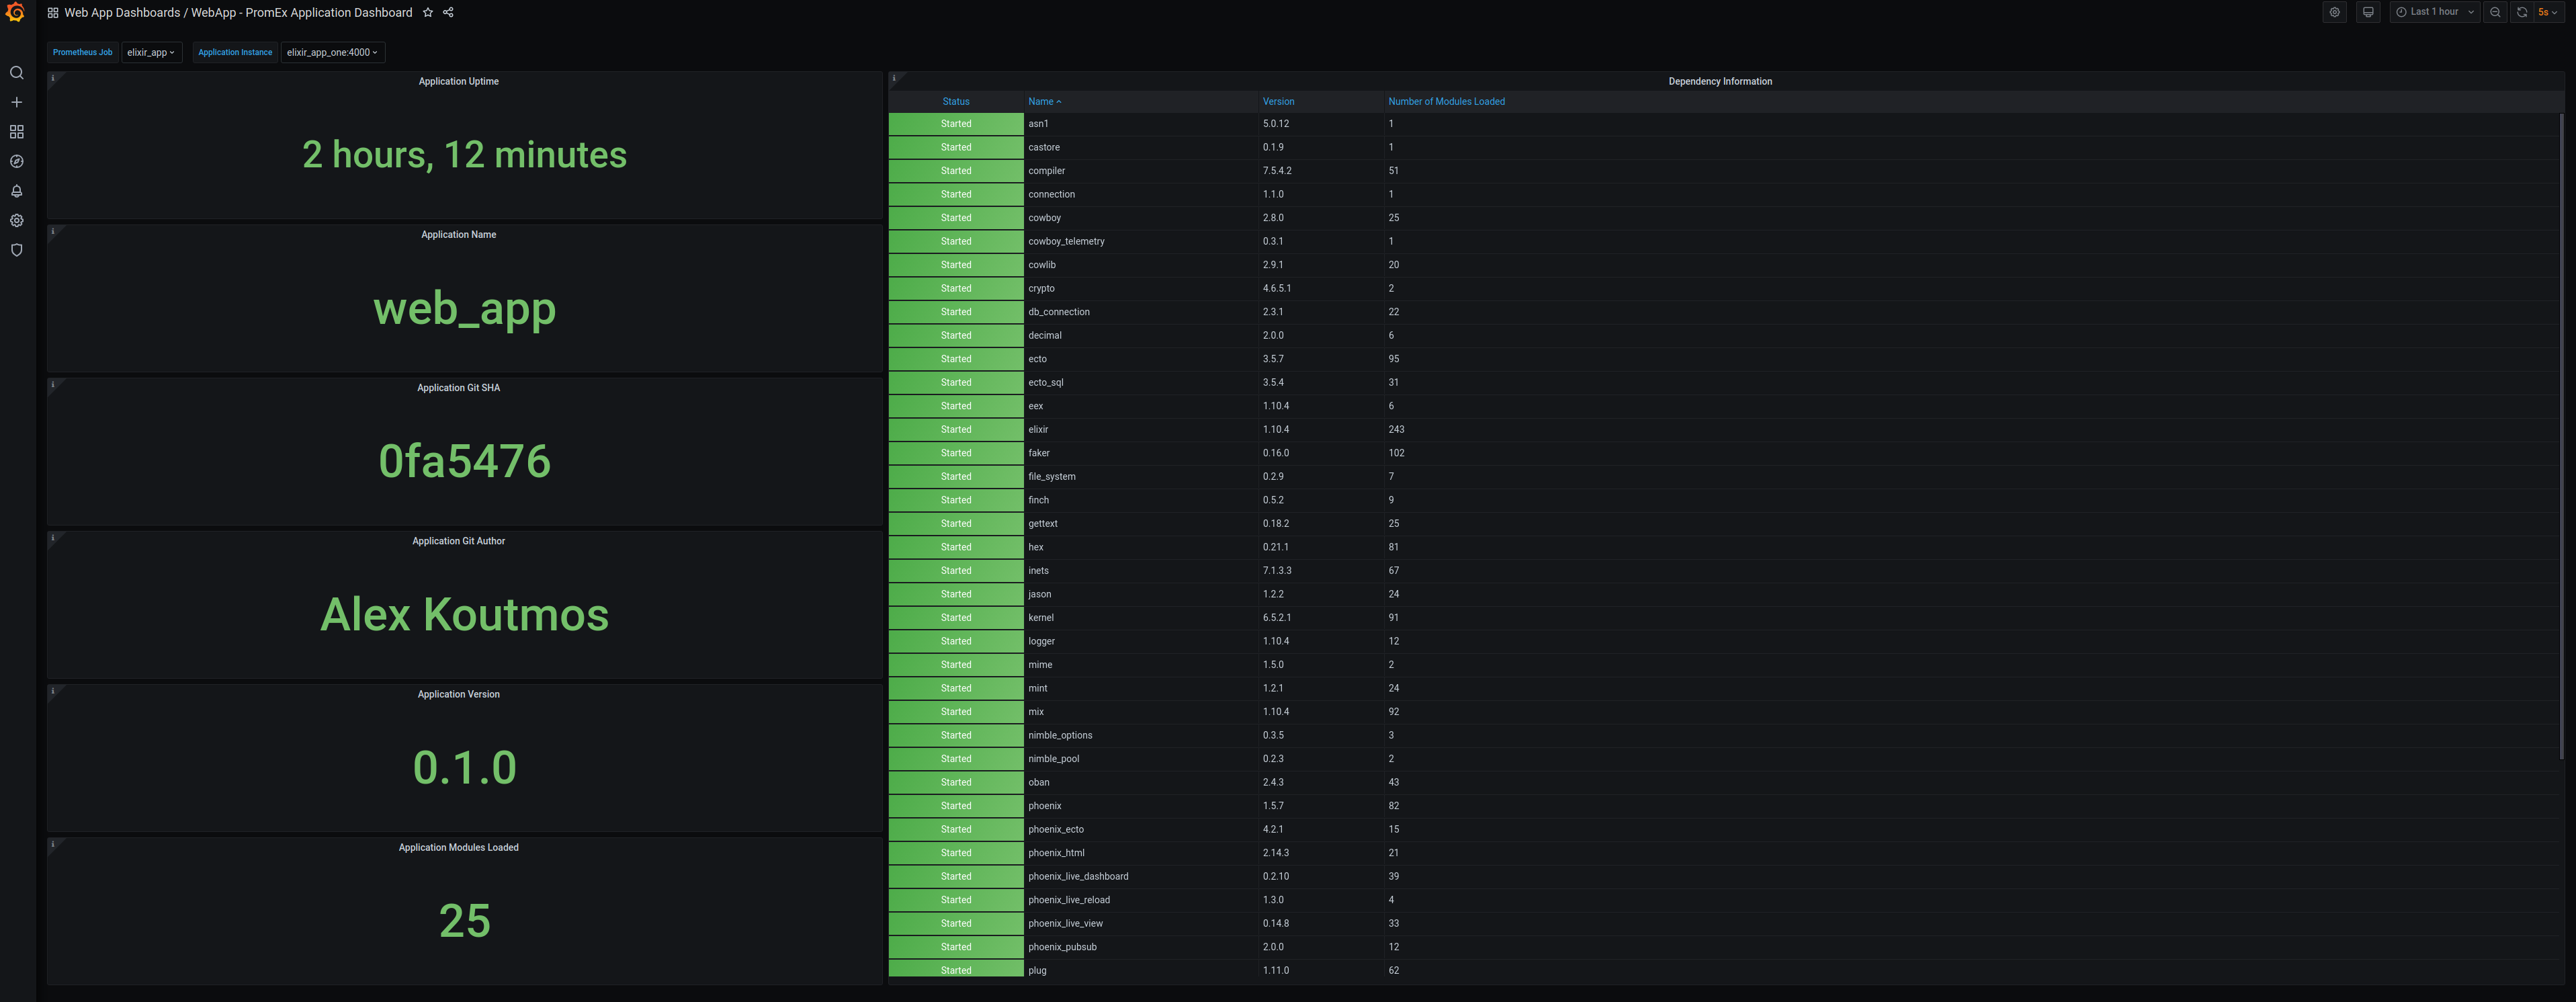
Application
The application dashboard surfaces static information regarding the application. Things such as the dependencies of the application, GIT SHA+author and uptime.
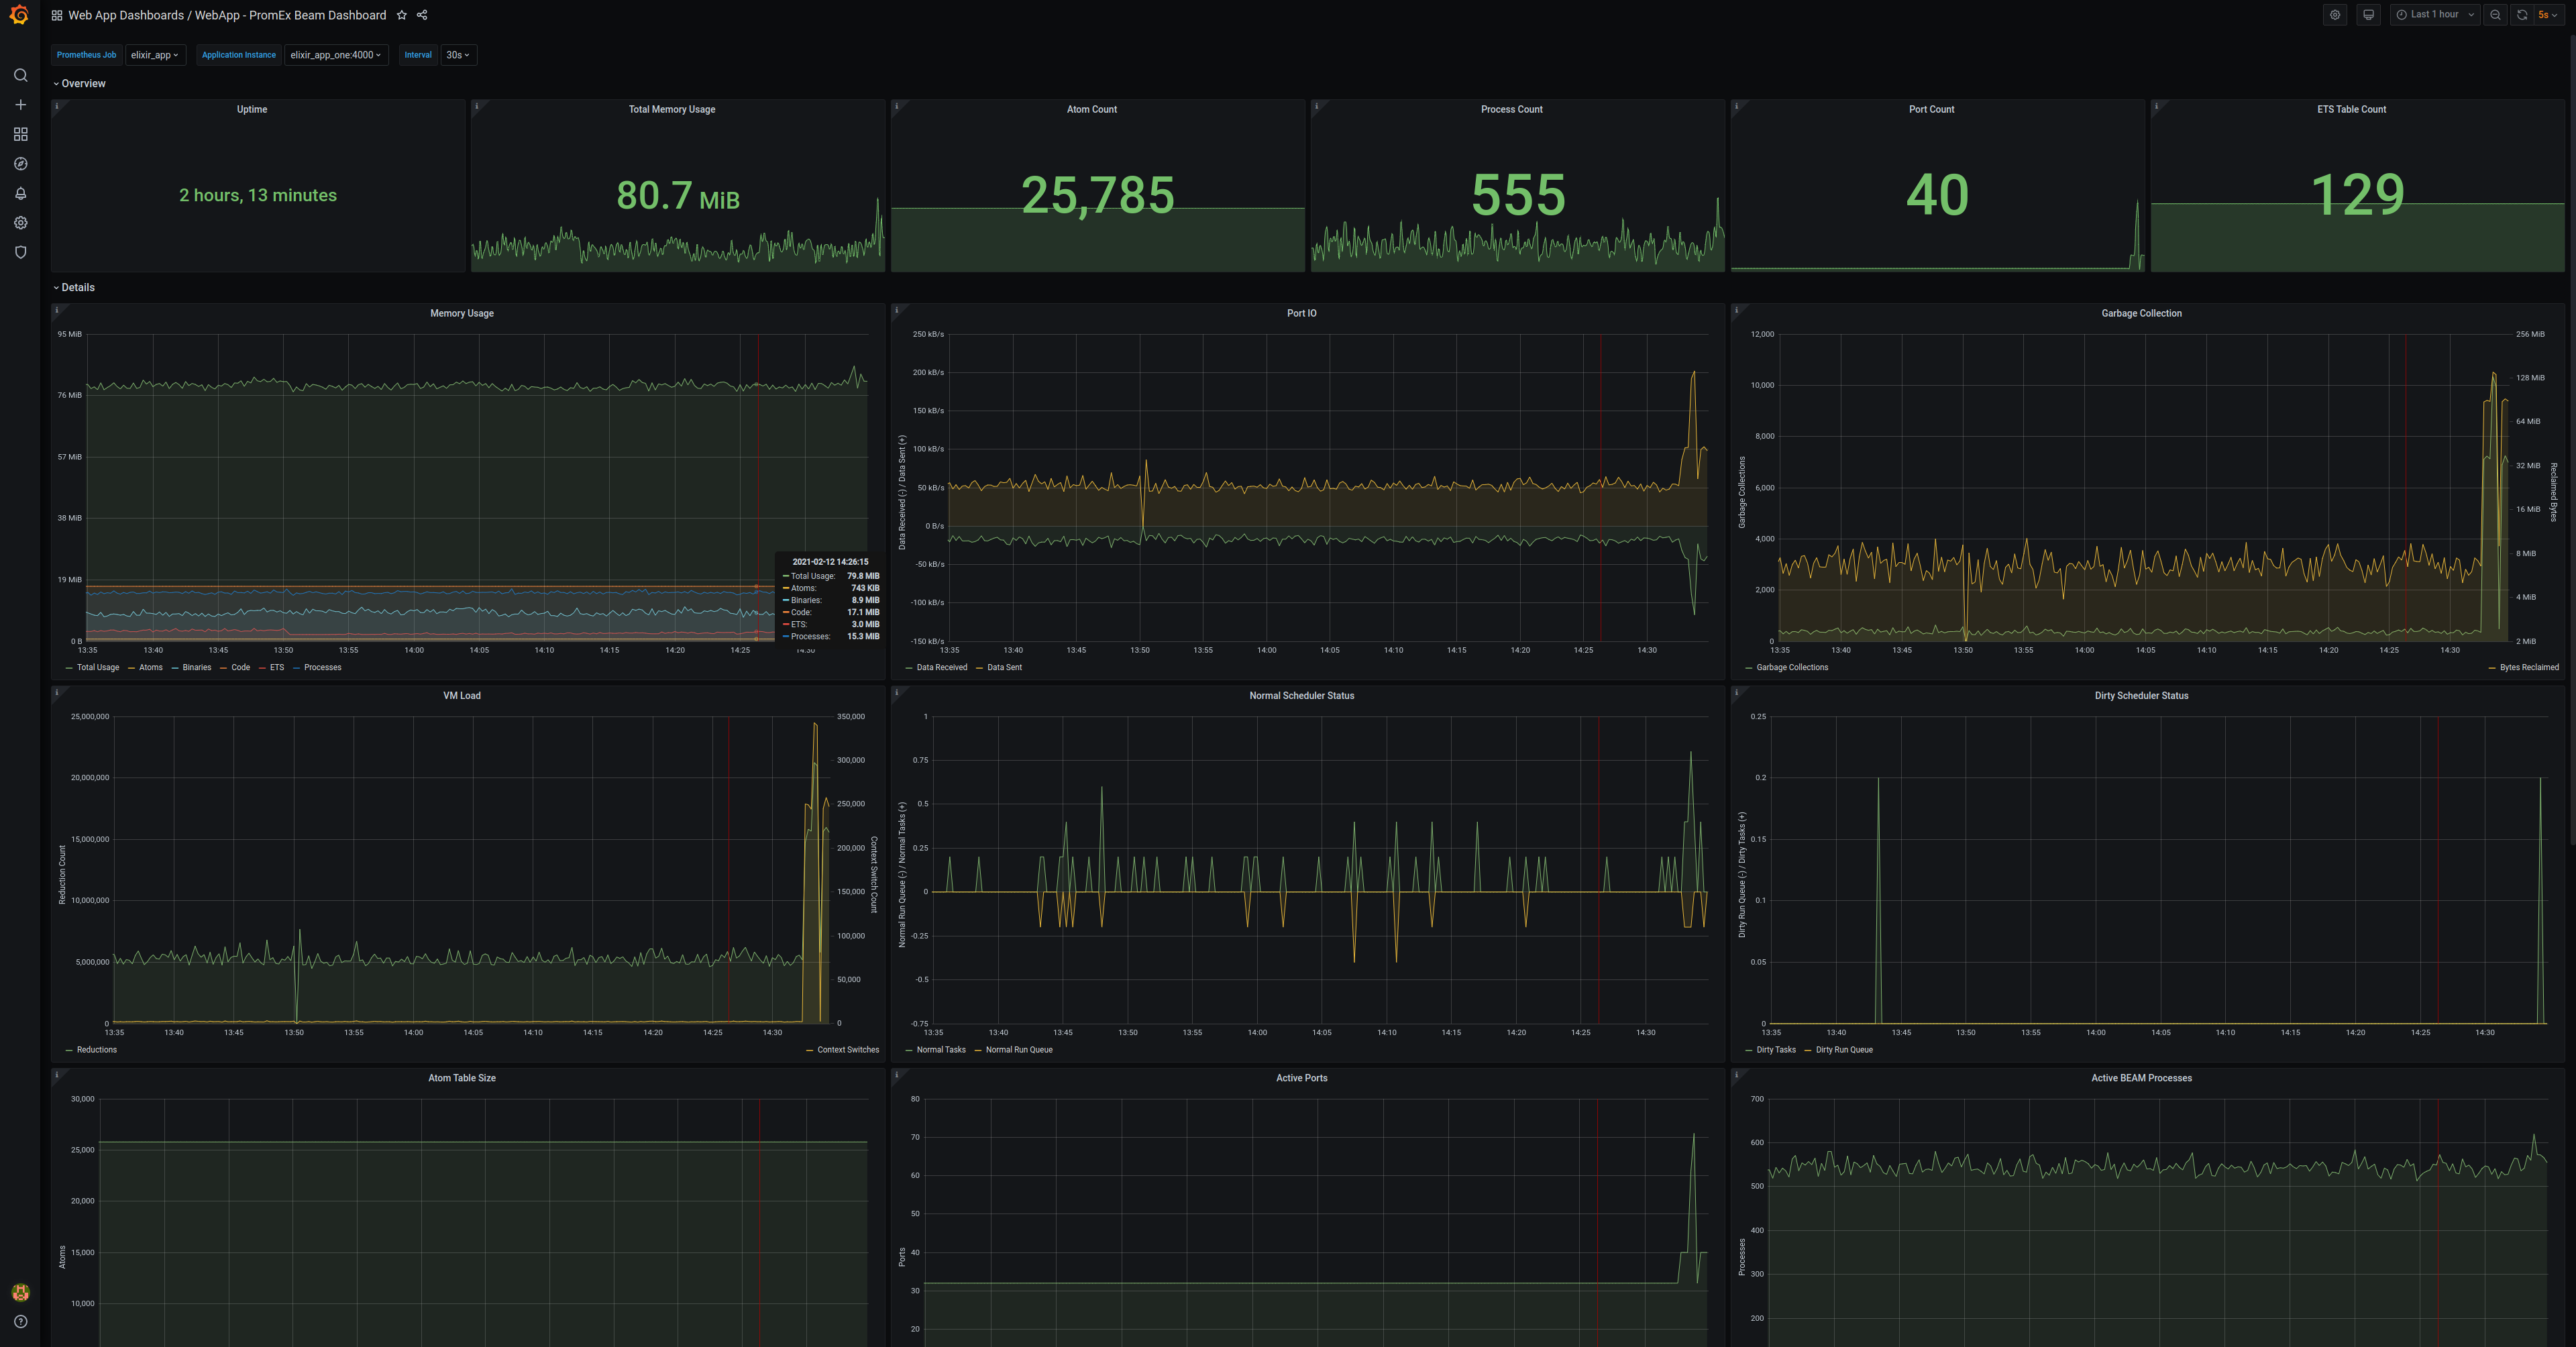
BEAM
The BEAM dashboard presents information regarding the Erlang virtual machine. Things such as memory statistics, process and atom counts, scheduler information, and much more
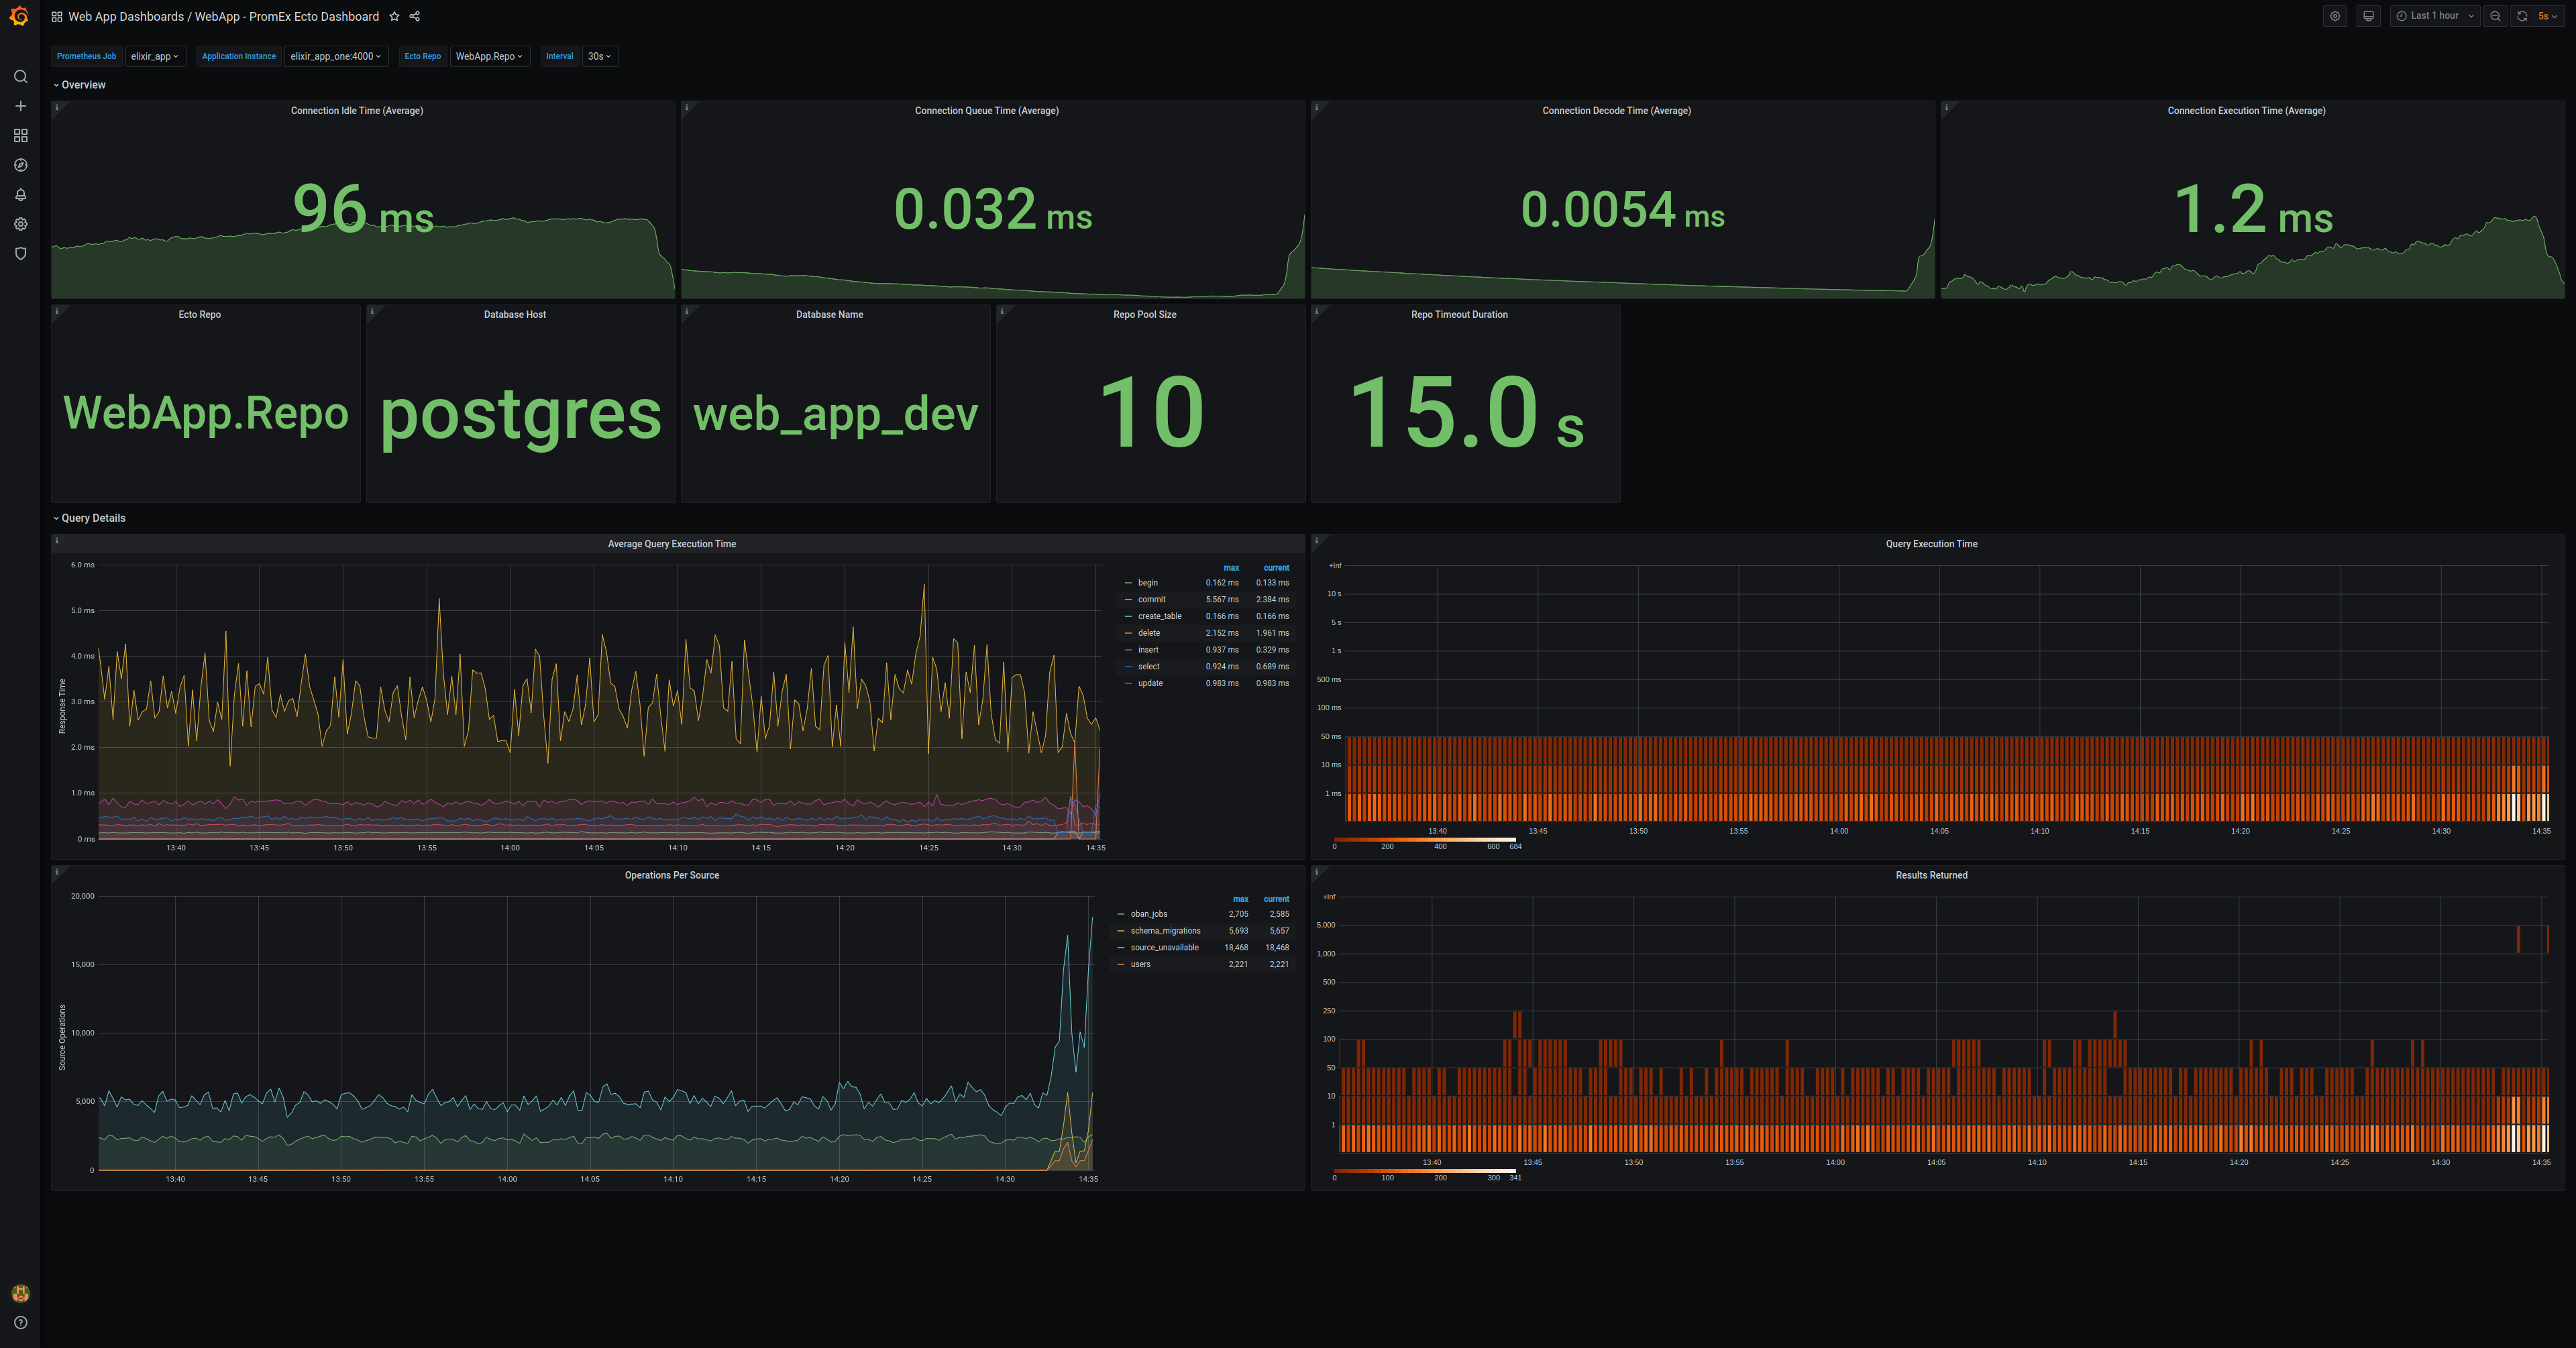
Ecto
The Ecto dashboard contains charts to track query execution time, number of results returned, and static information regarding the configured Repo.
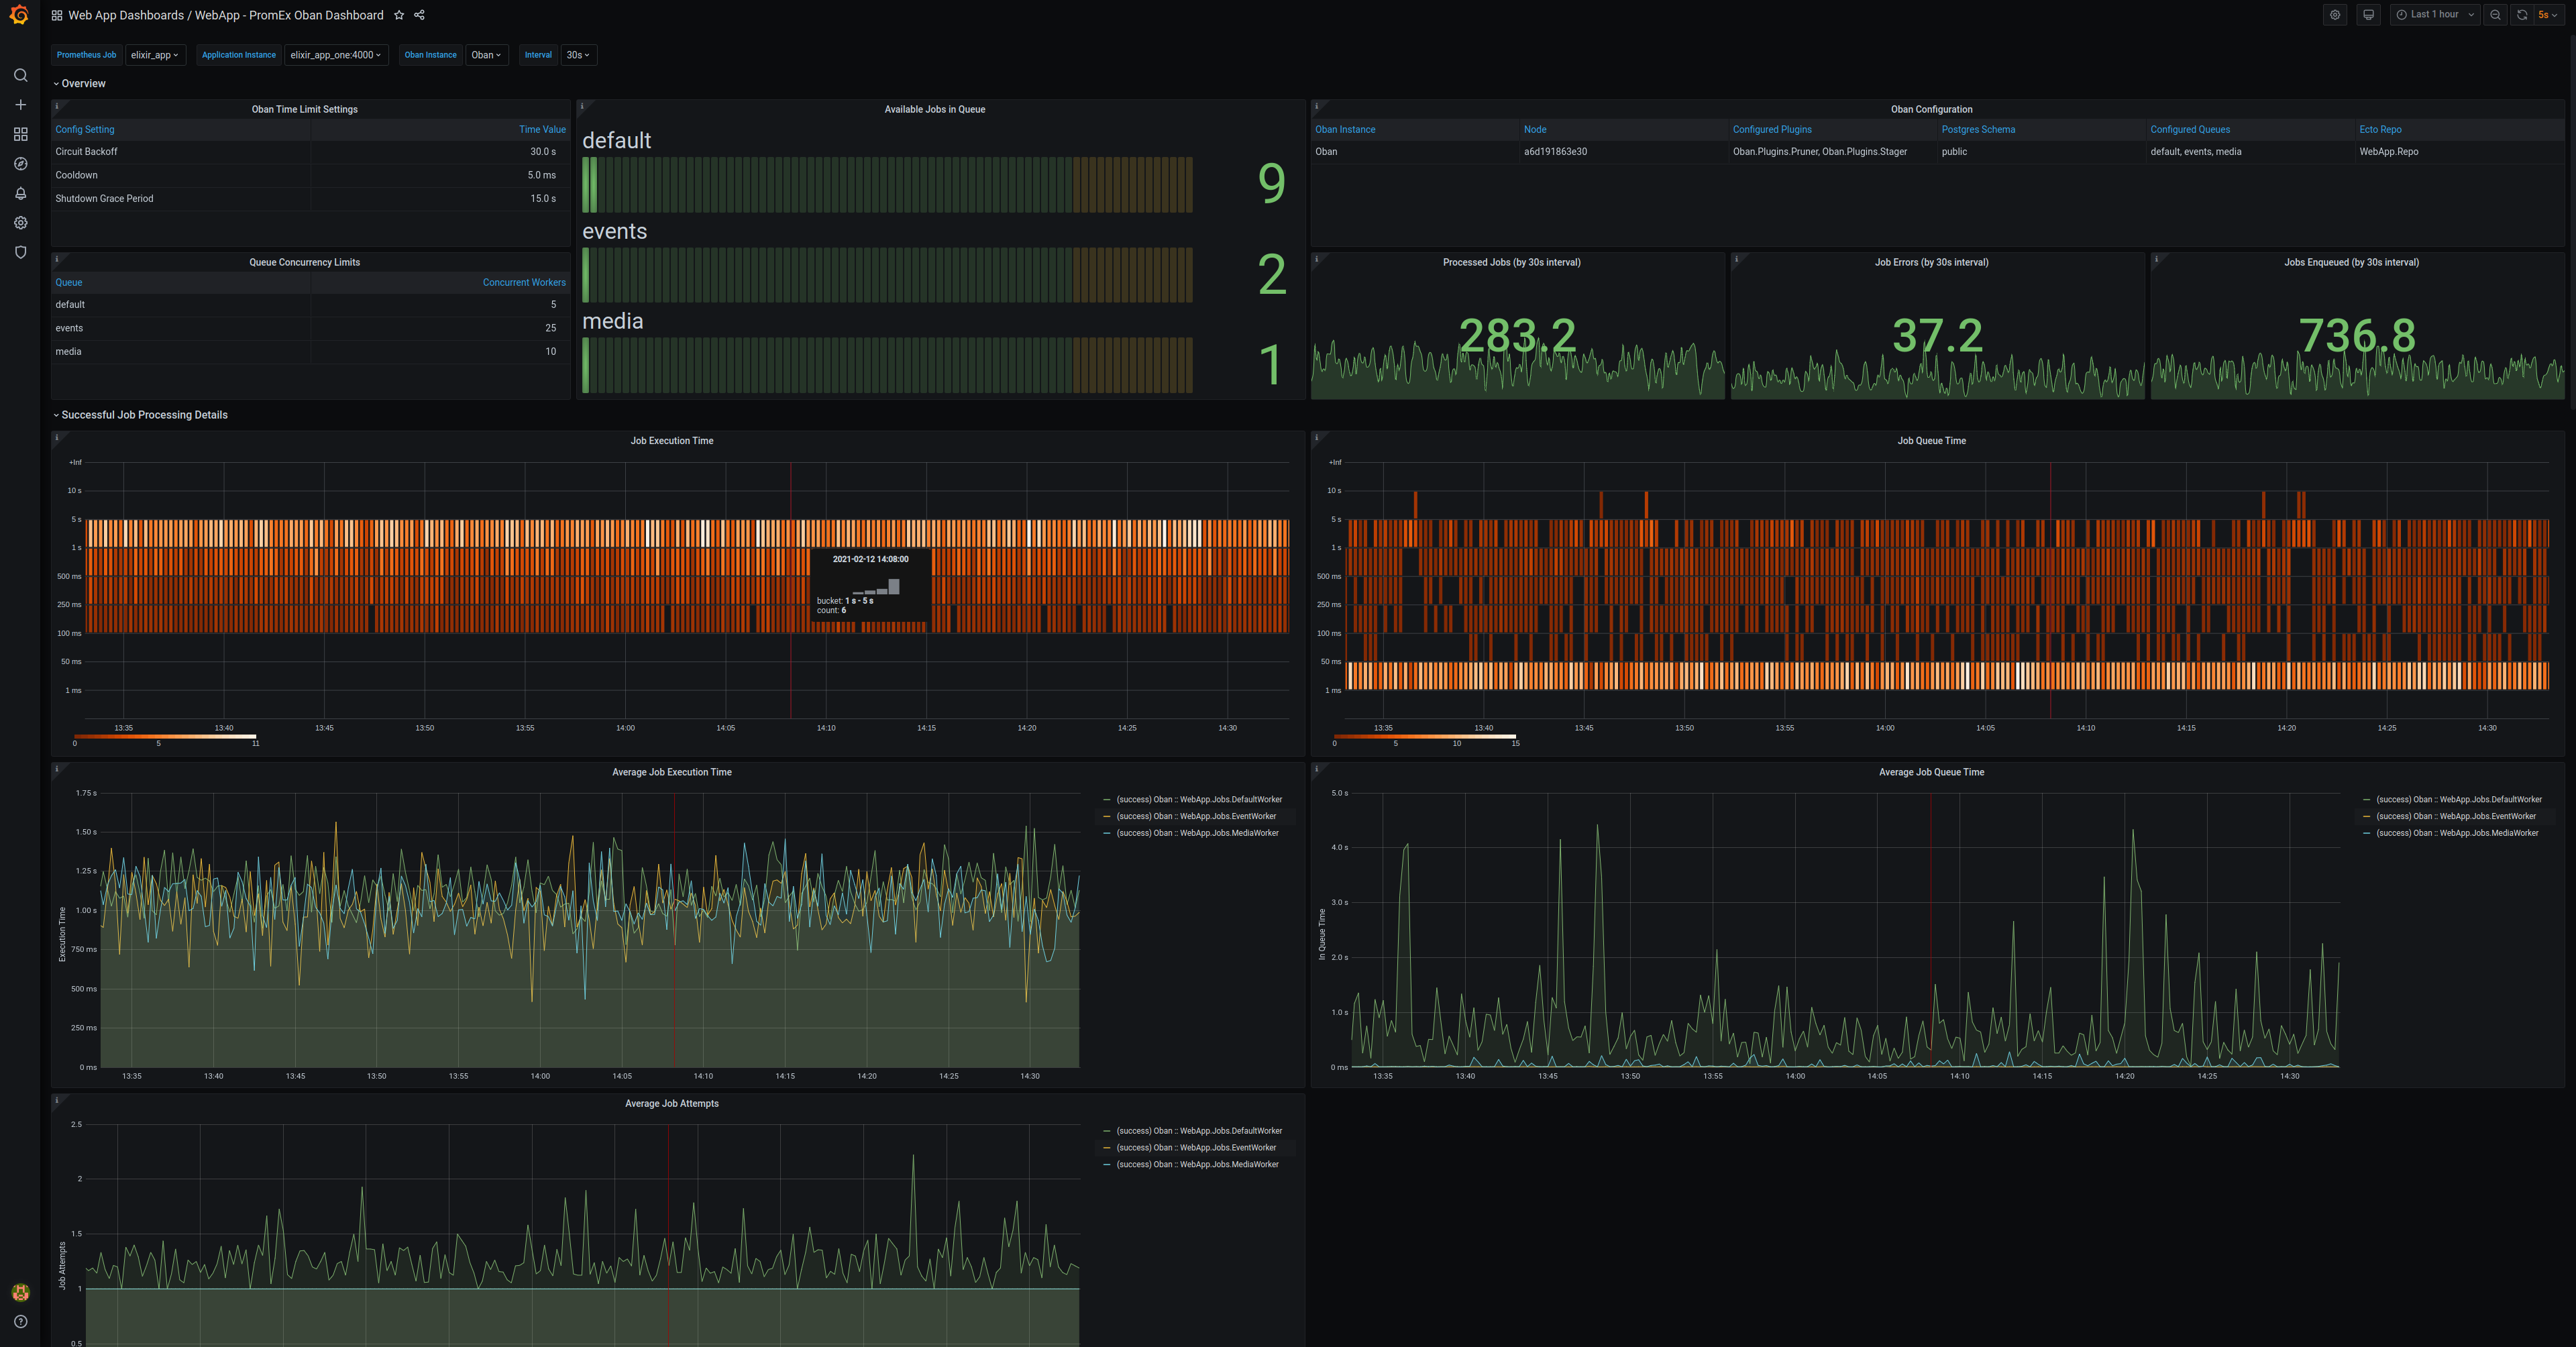
Oban
The Oban plugin presents information regarding the job execution time, job queue time, available jobs in queue, static configuration settings and much, much more.
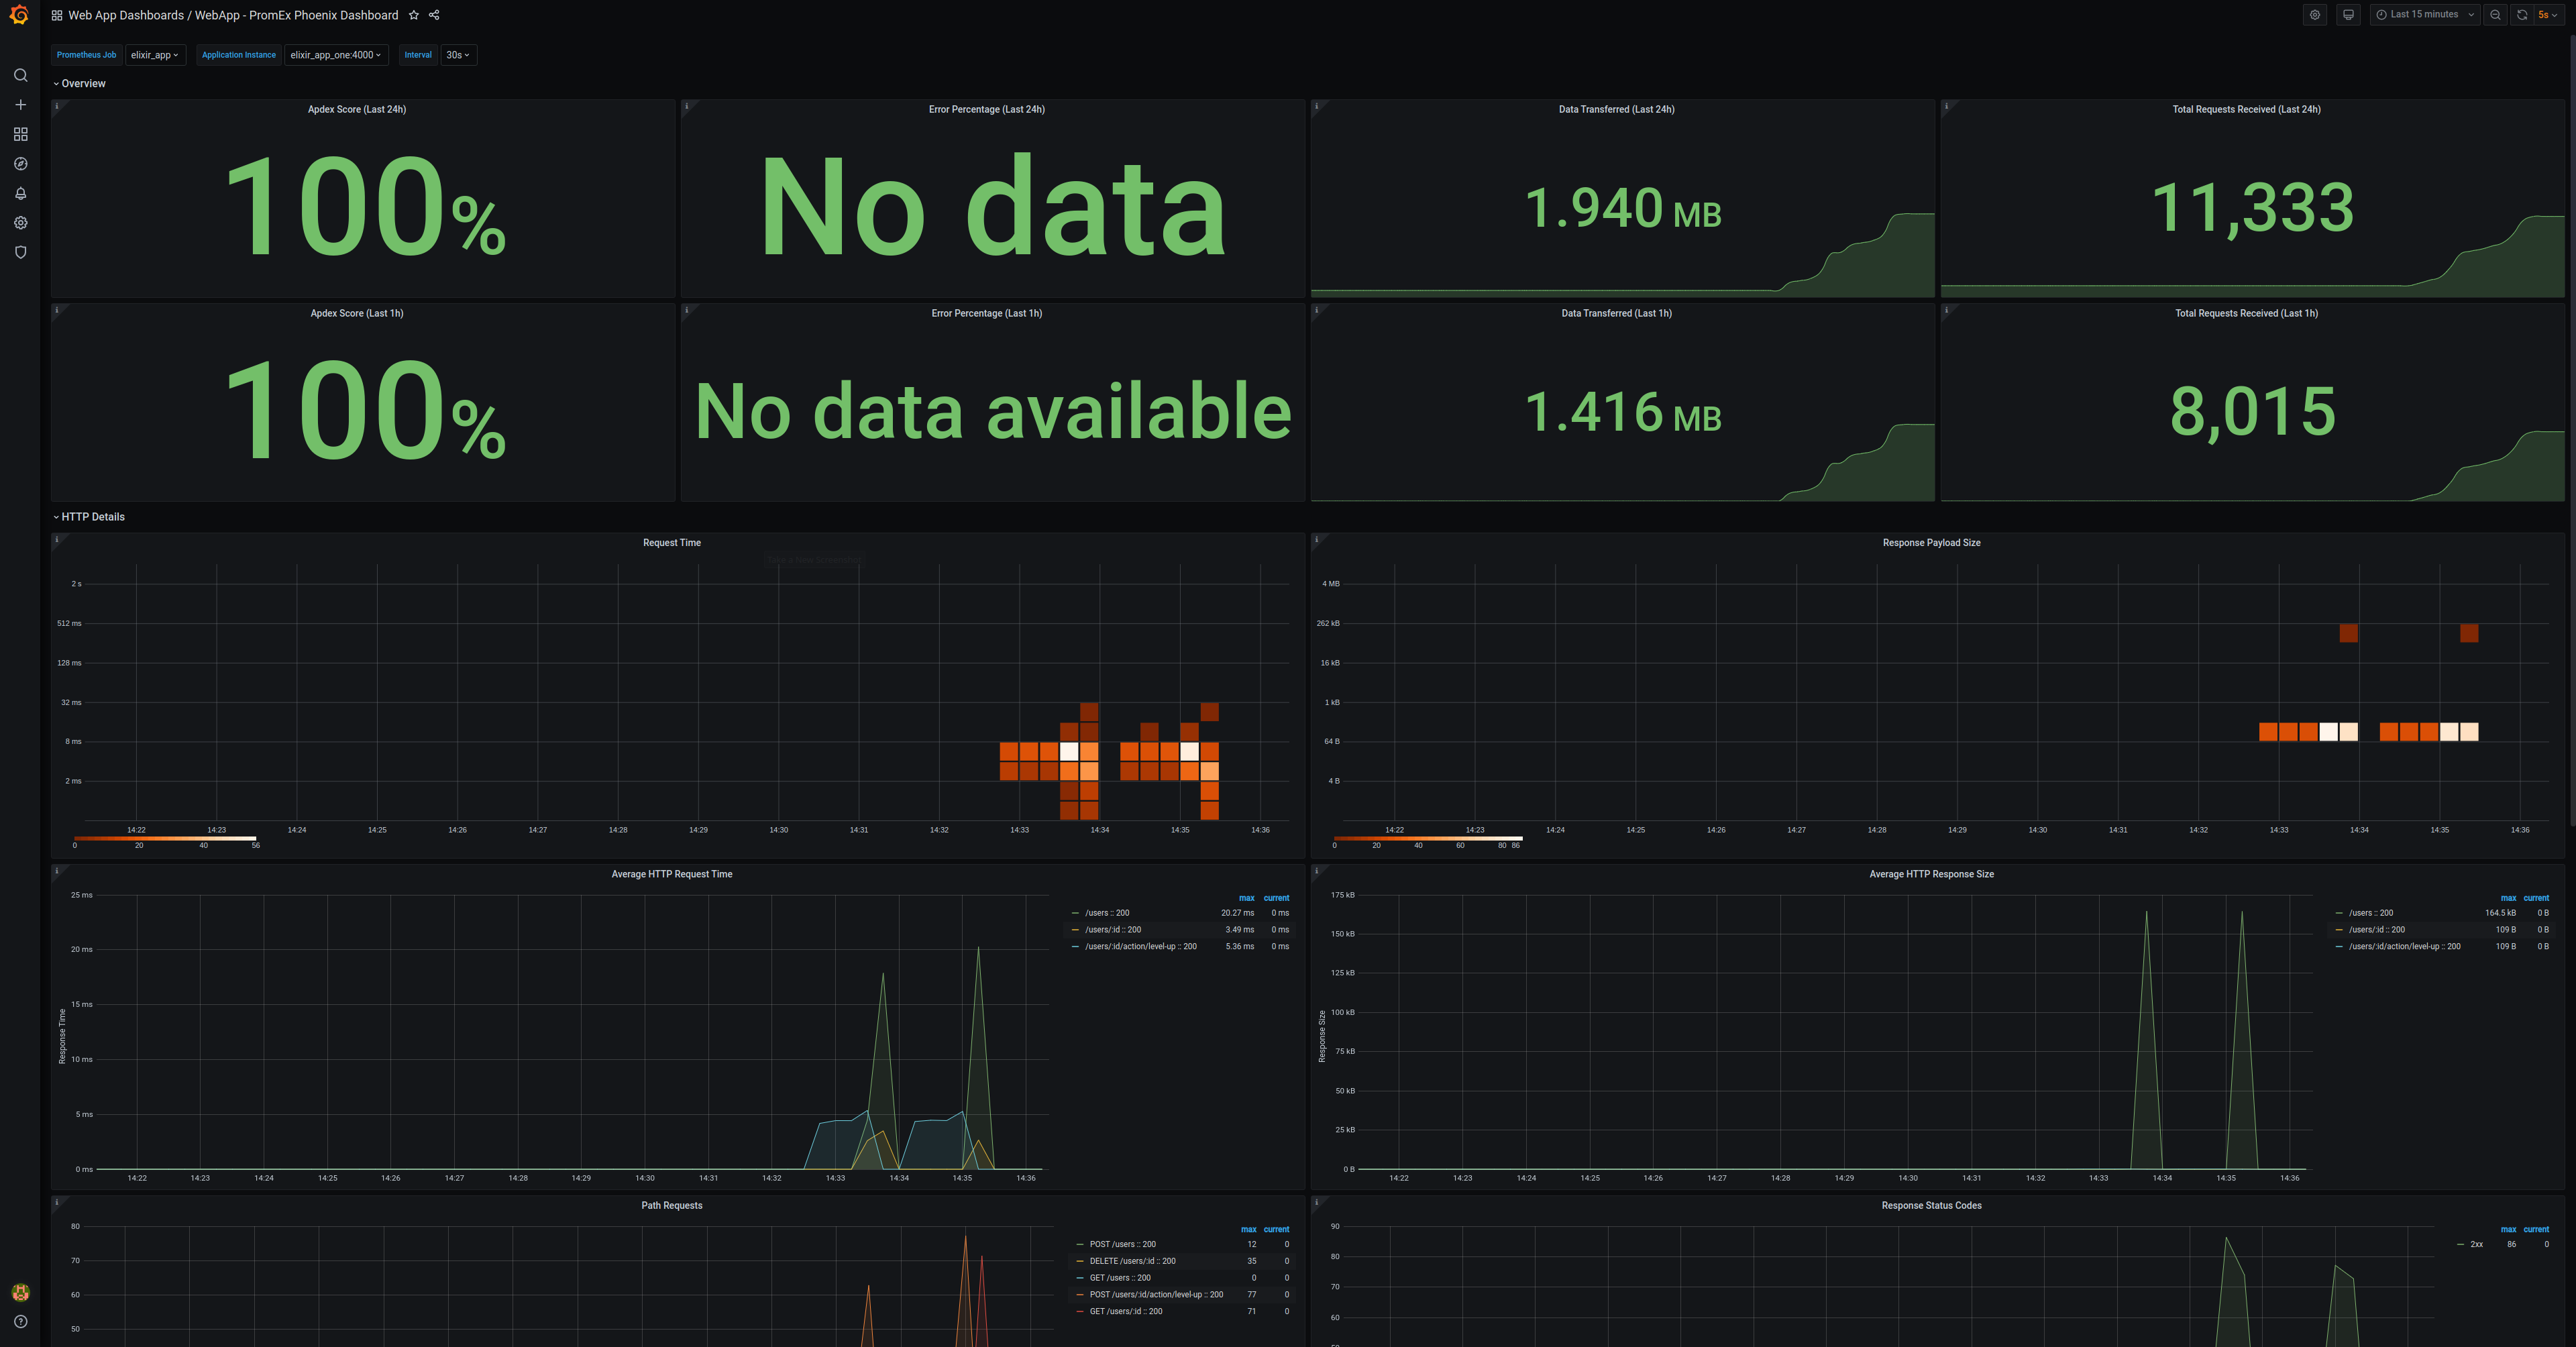
Phoenix
The Phoenix dashboard presents information regarding HTTP requests and channel connections.
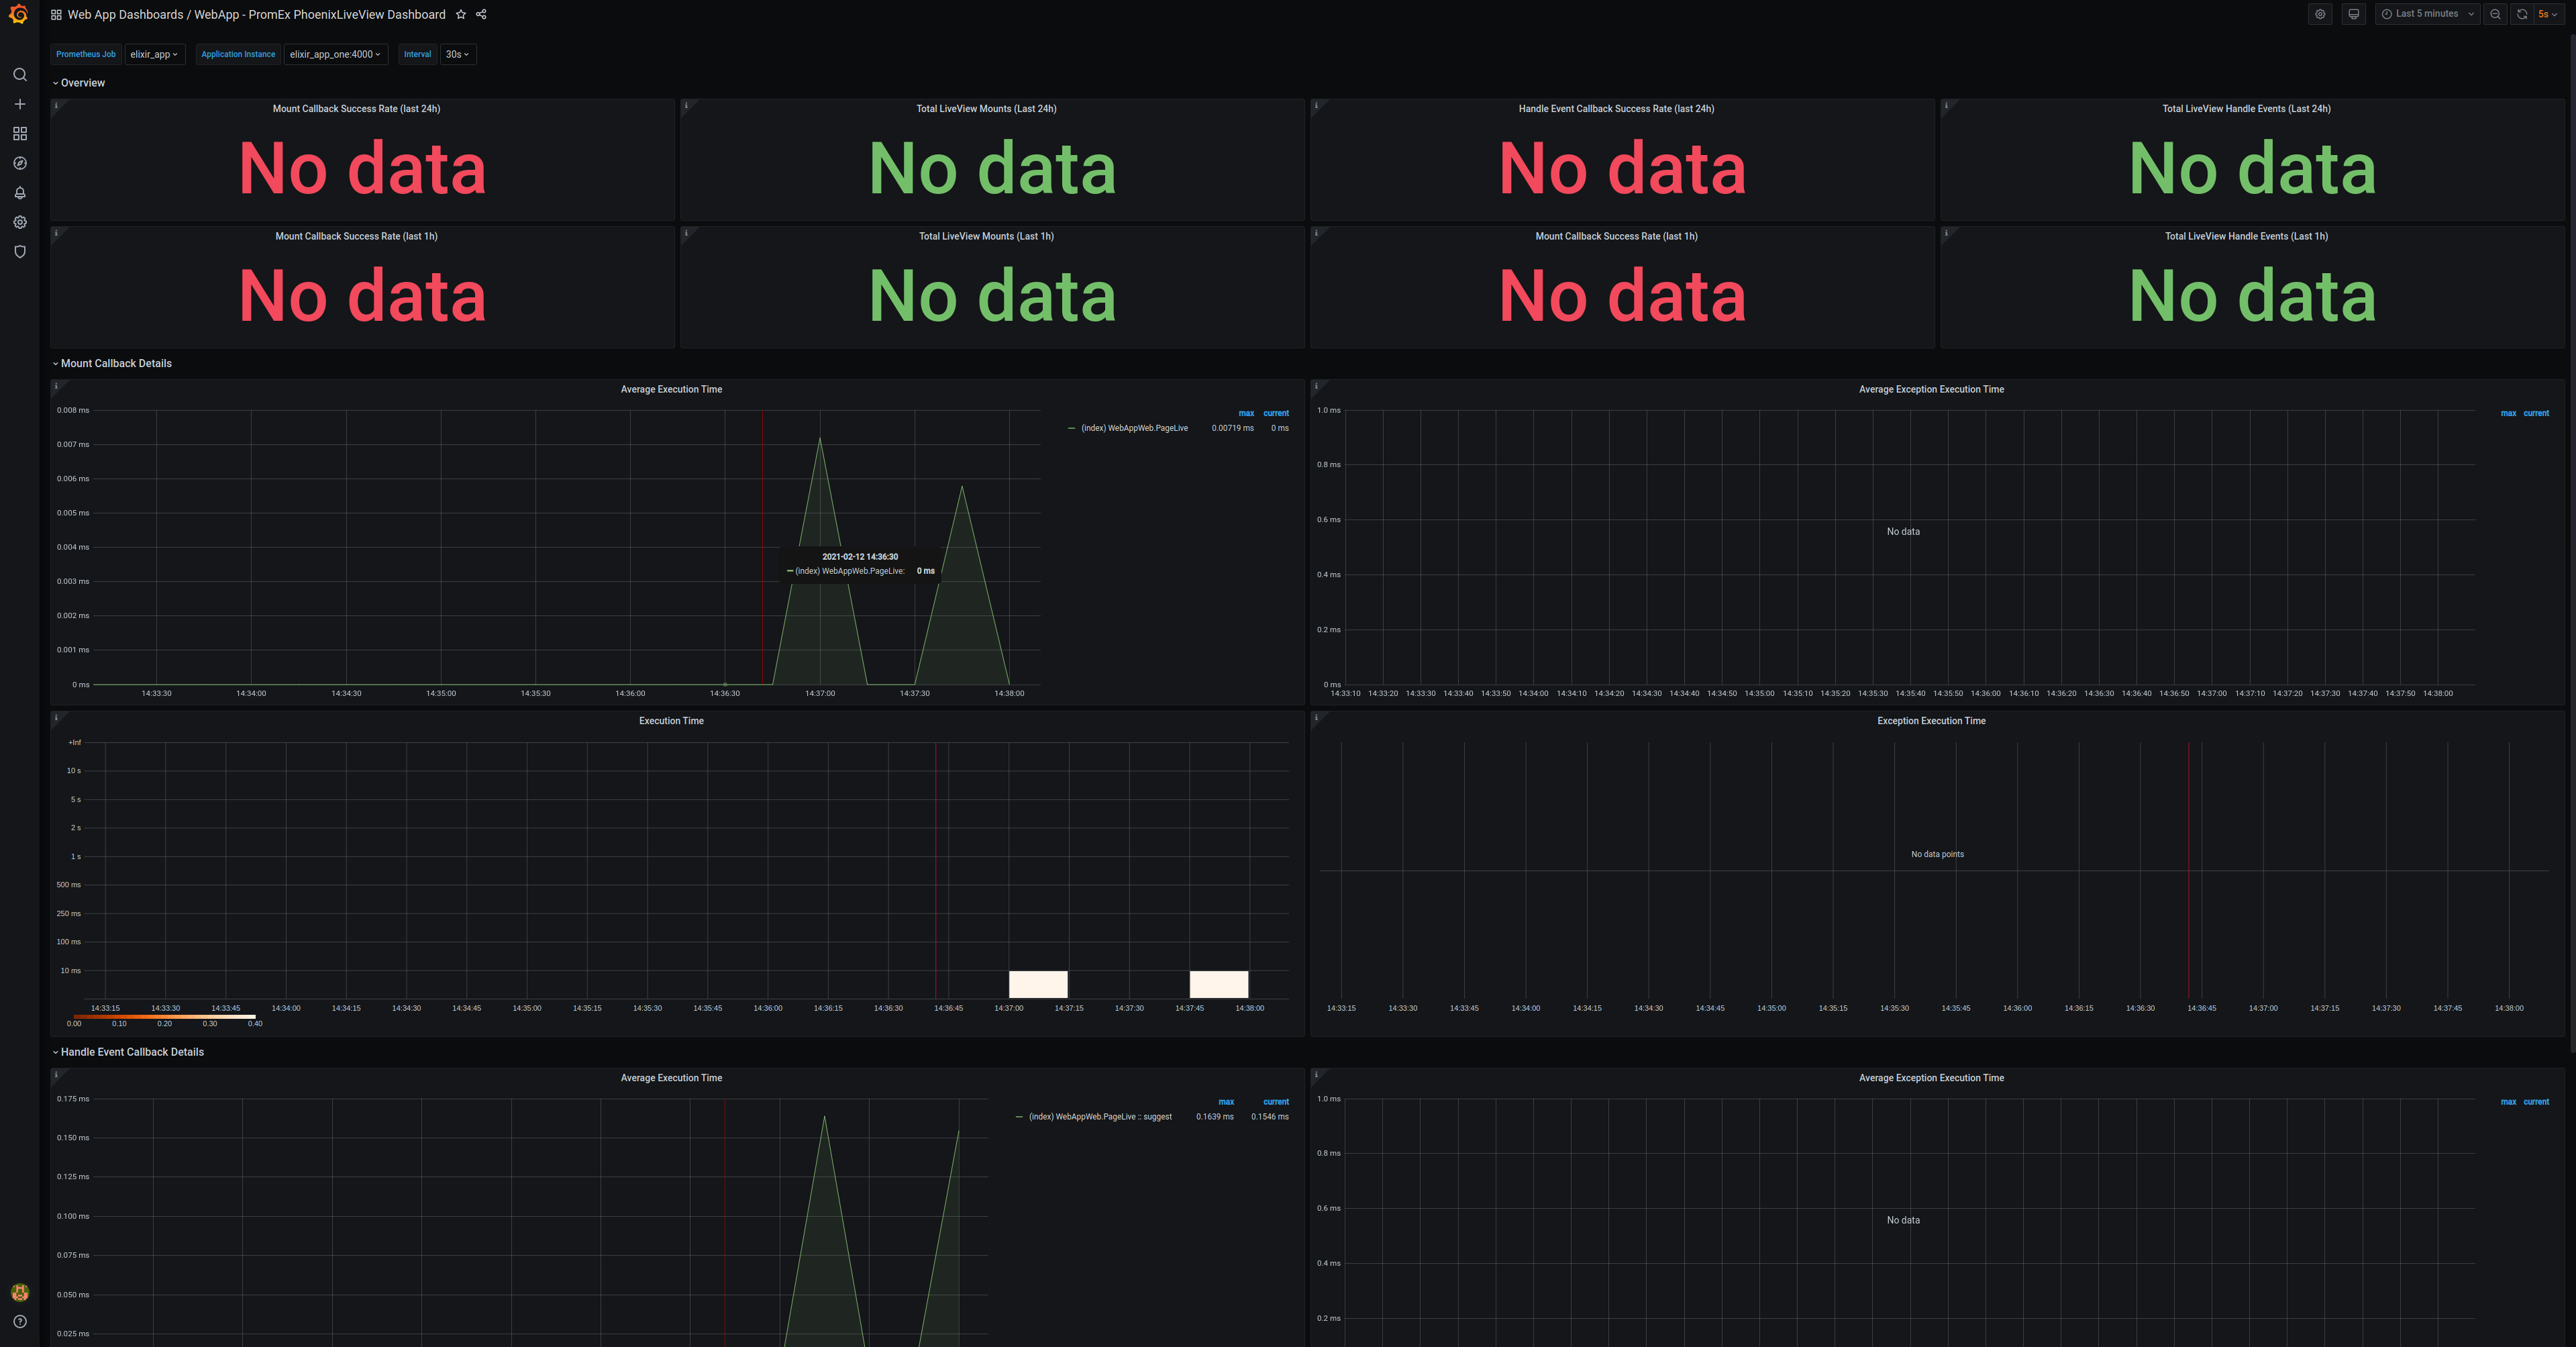
Phoenix LiveView
The Phoenix LiveView dashboard presents information regarding the various LiveView callbacks and the time it takes to execute them.
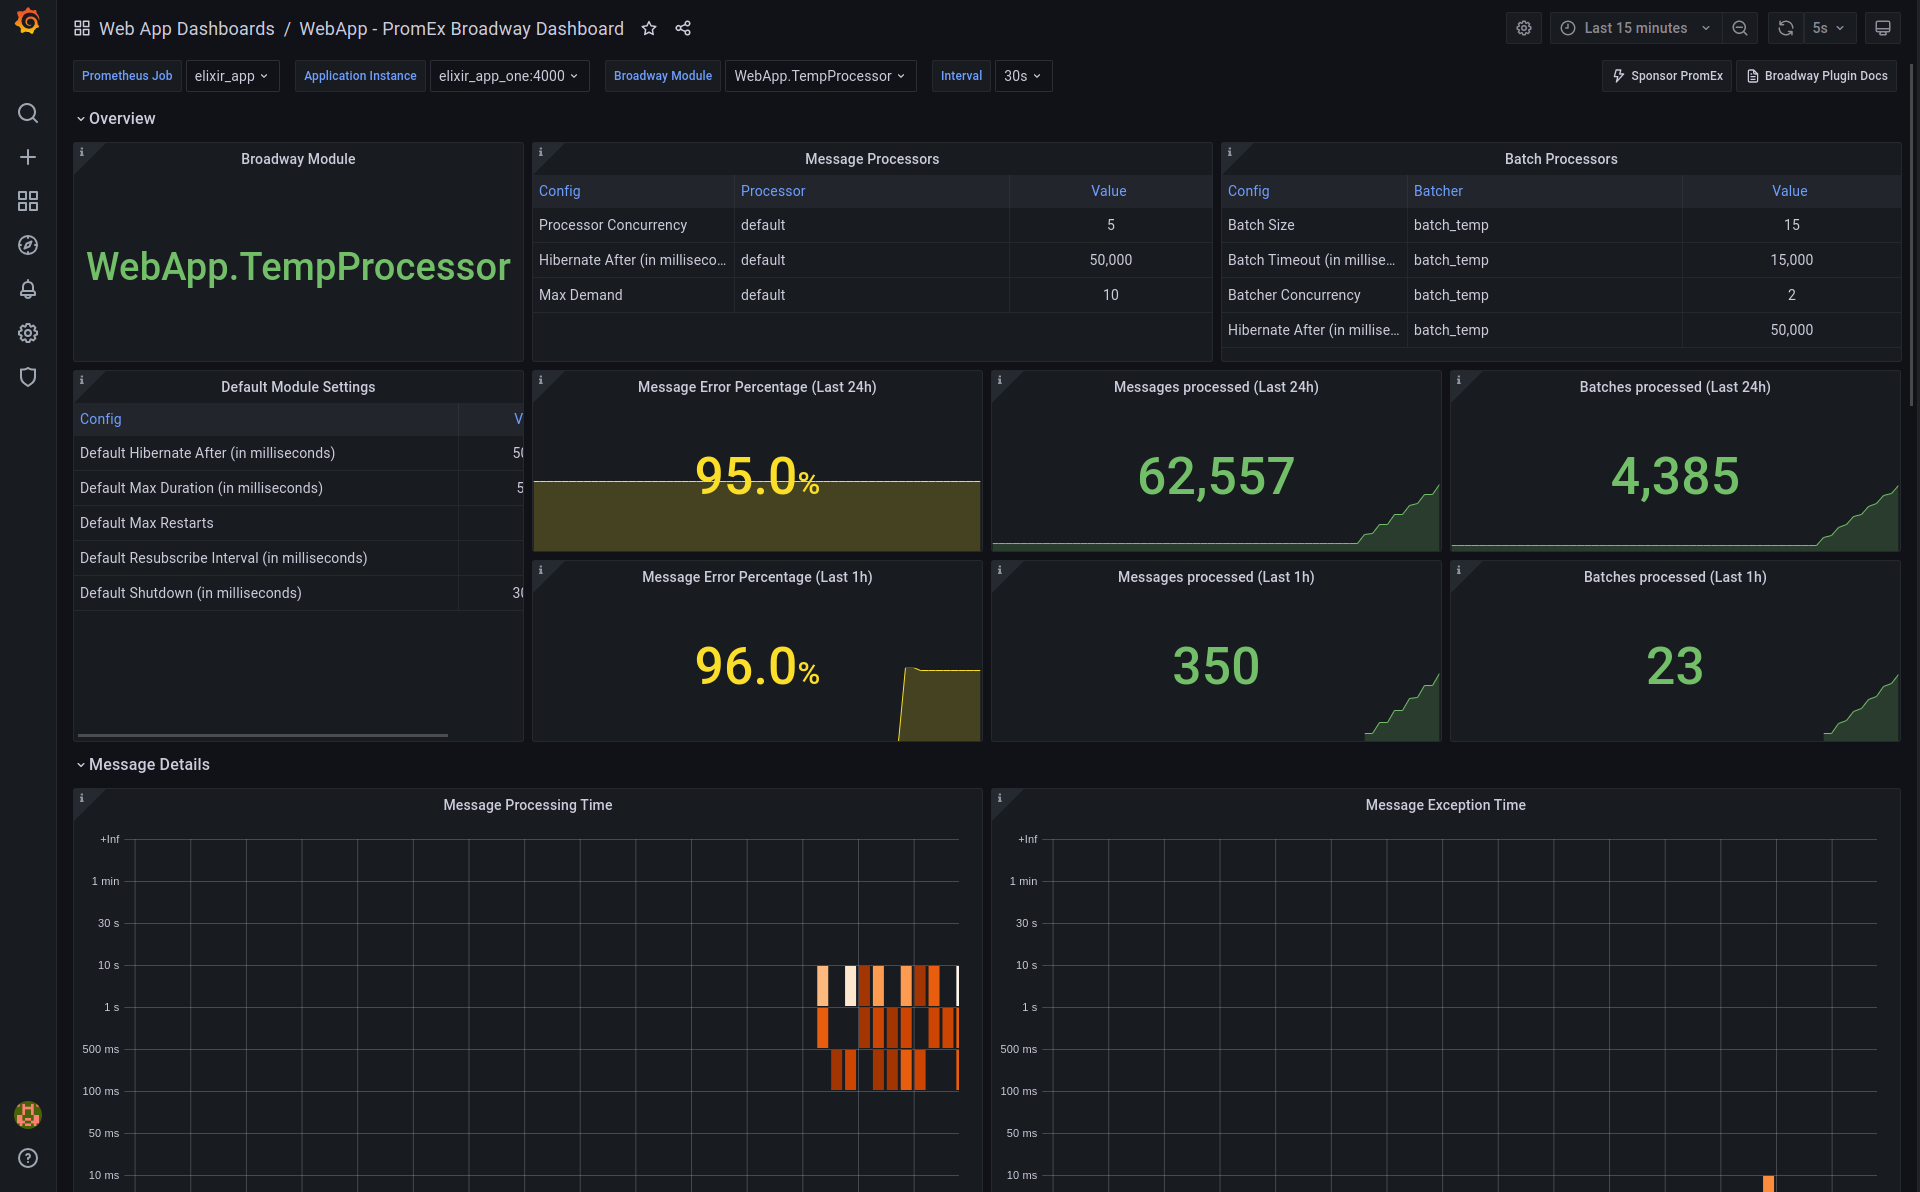
Broadway
The Broadway dashboard presents information regarding the messages the Broadway has processed as well as how it has processed message batches.